Best Measurement
Our project made use of several assays to identify the target proteins expressed by E. Coli, and to analyze the efficacy of enzymes produced.
SDS-PAGE & Coomassie Blue Staining
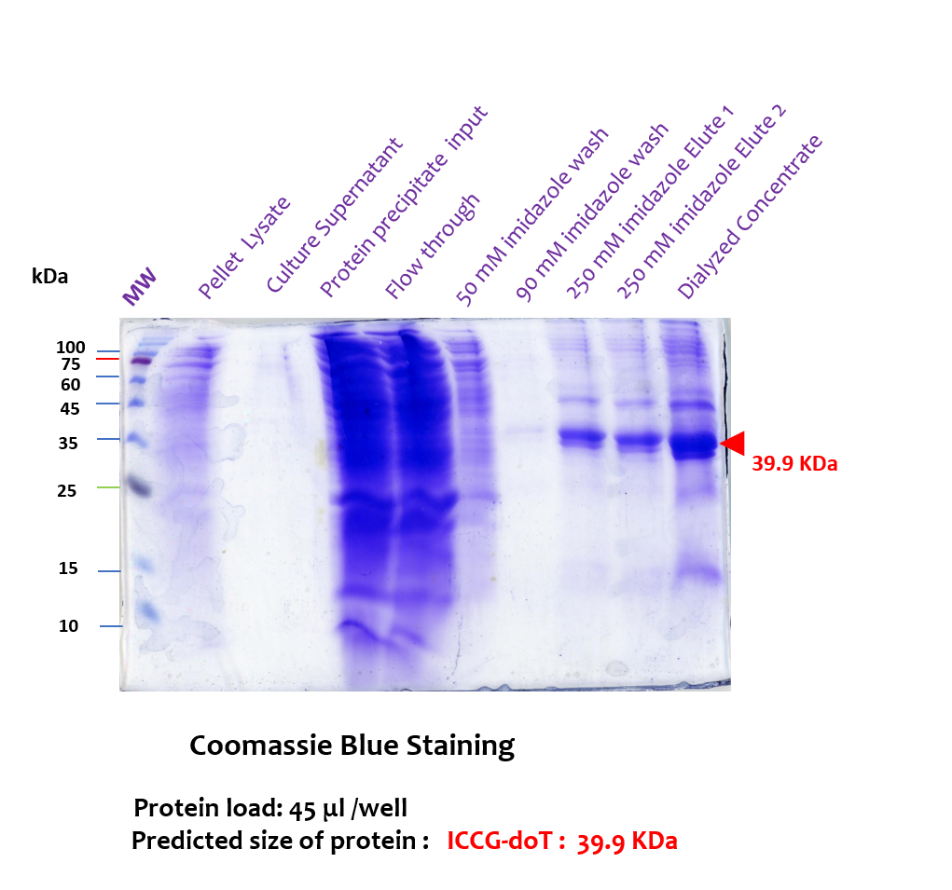
Protein purification results were evaluated using SDS-PAGE and Coomassie Blue staining for visualization. SDS-PAGE (sodium dodecyl sulphate–polyacrylamide gel electrophoresis) was used to assess the molecular weight, purity, and relative abundance of target proteins. Coomassie Blue R-250 staining provides total protein visualisation.
10% polyacrylamide separating gels were used for SDS-PAGE, providing optimal resolution in the 18–75 kDa range — appropriate for ICCG-DoT. Following addition of Coomassie Blue staining solution, gels were placed in orbital shakers at room temperature for 10 minutes. Destaining solution was then added and gels were shaken overnight at room temperature. Photographs of the final stained product were conducted under white light.
Result: The SDS-PAGE gel (Coomassie Blue staining) shows total protein in sequential purification fractions from the Ni-NTA IMAC column. A prominent band at approximately 39.9 kDa is visible in the 250 mM imidazole elution fractions (Elute 1 and Elute 2) and in the Dialysed Concentrate lane, consistent with the predicted molecular weight of ICCG-DoT. Lanes and observations are detailed below.
Western Blot
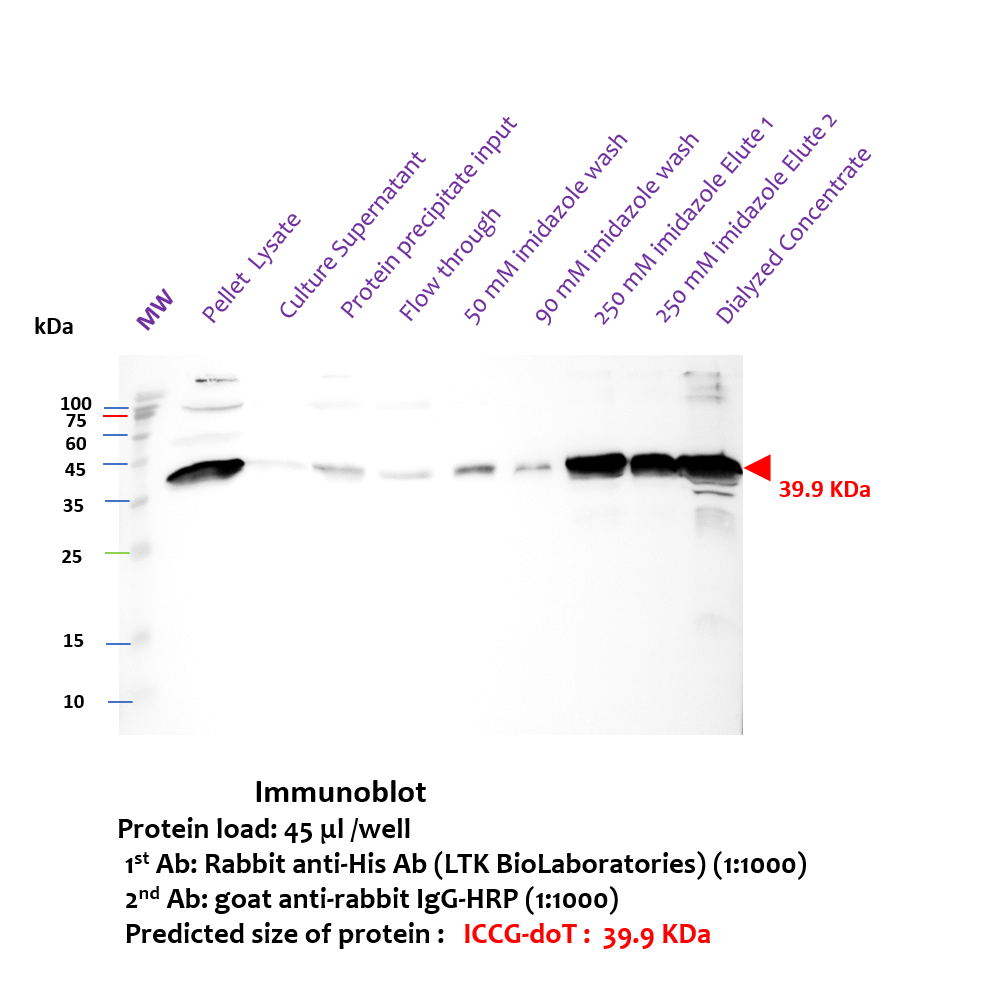
To confirm the identity of the expressed target proteins, Western Blotting was used with an anti-His-tag antibody. Following SDS-PAGE, proteins were transferred to a PVDF membrane and probed sequentially with primary (anti-His) and secondary (HRP-conjugated) antibodies. Visualization was performed by enhanced chemiluminescence (ECL).
Primary and secondary antibodies were diluted 1:1000 in TTBS and added to the membrane before being incubated at 4°C overnight in an orbital shaker. Membranes were then washed 3 times with TTBS.
Result: Western blot using anti-His antibody detections confirmed the identity of the ~39.9 kDa band observed in the SDS-PAGE as the His-tagged ICCG-DoT protein.
Qualitative Enzyme Activity Assay: DMSO-Dissolved PET Agar Plate Assay
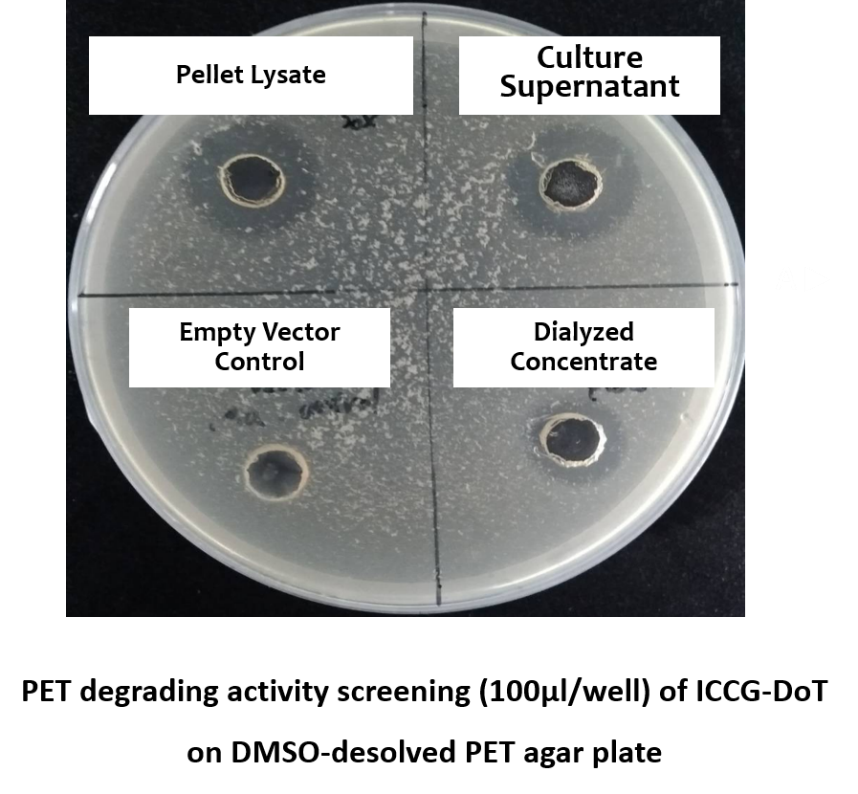
To provide a qualitative assessment of PET-degrading activity directly from bacterial cell fractions, PET was dissolved in DMSO and incorporated into agar, forming a turbid plate. Enzymatic degradation of PET produces a visible clearing halo around the well, indicating hydrolytic activity.
Result: The plate assay confirmed that the purified ICCG-DoT displayed PET-degrading activity, as shown by the presence of the clearing halo in the sections of the plate containing cell fractions. The absence of a halo in the empty vector control eliminates the possibility of non-specific background activity.
Quantitative Enzyme Activity Assay:
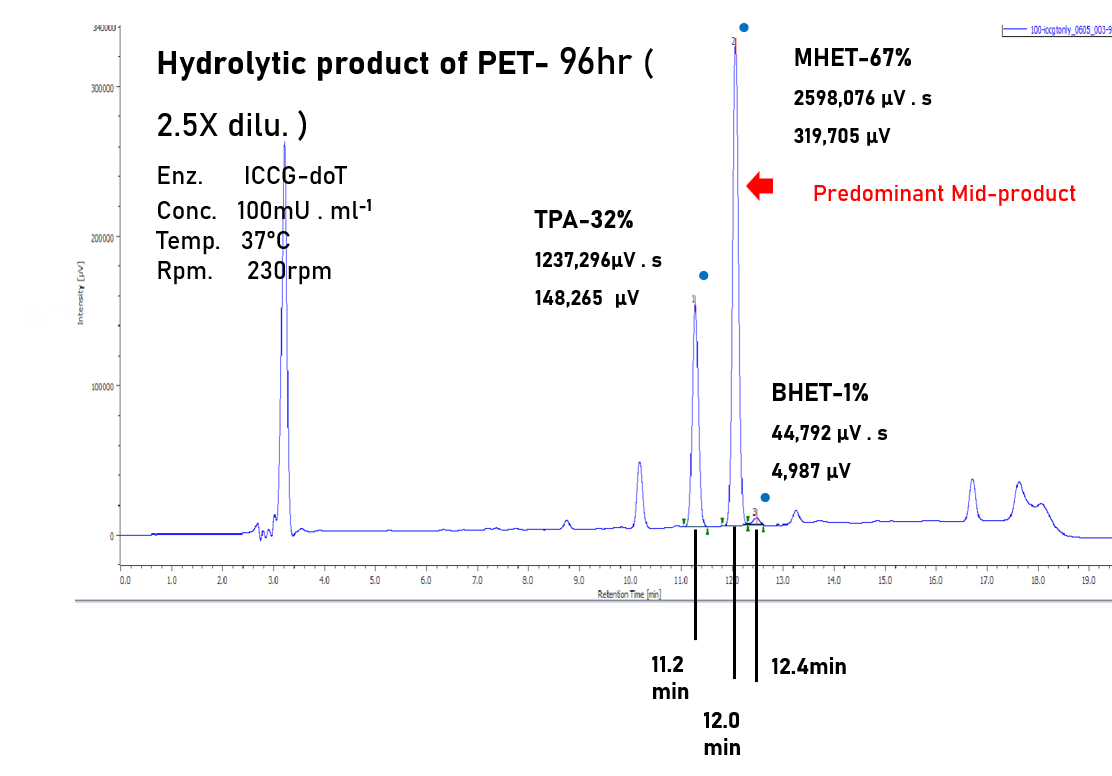
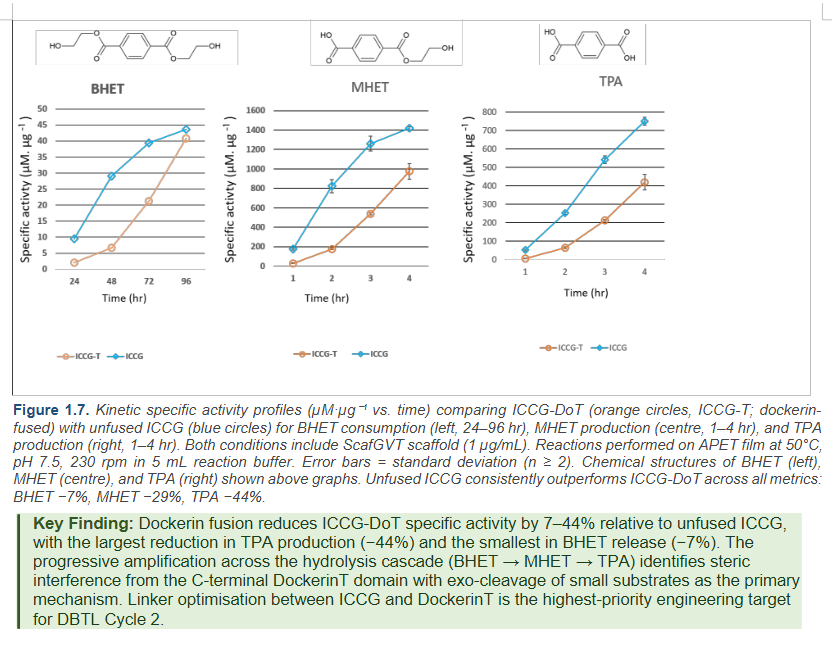
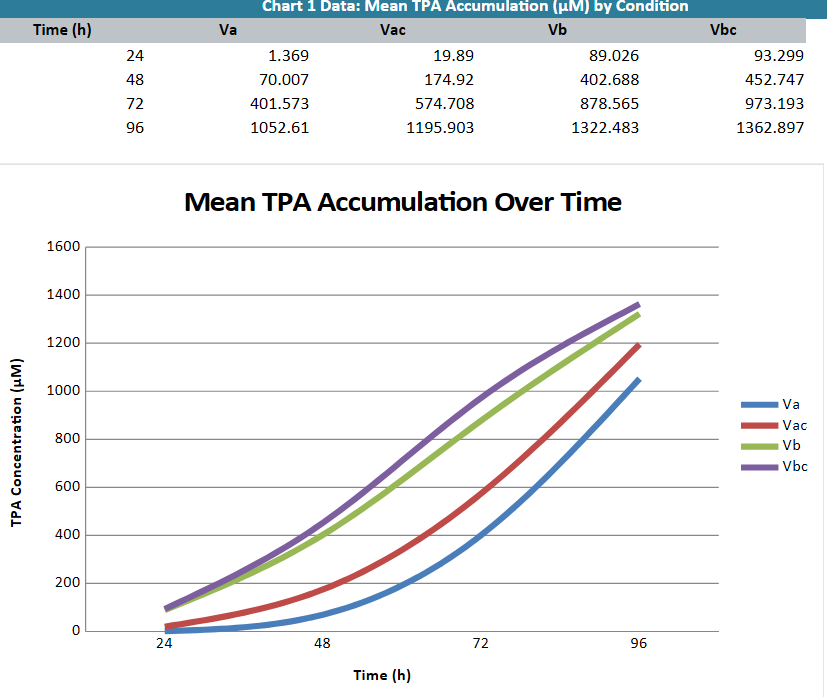
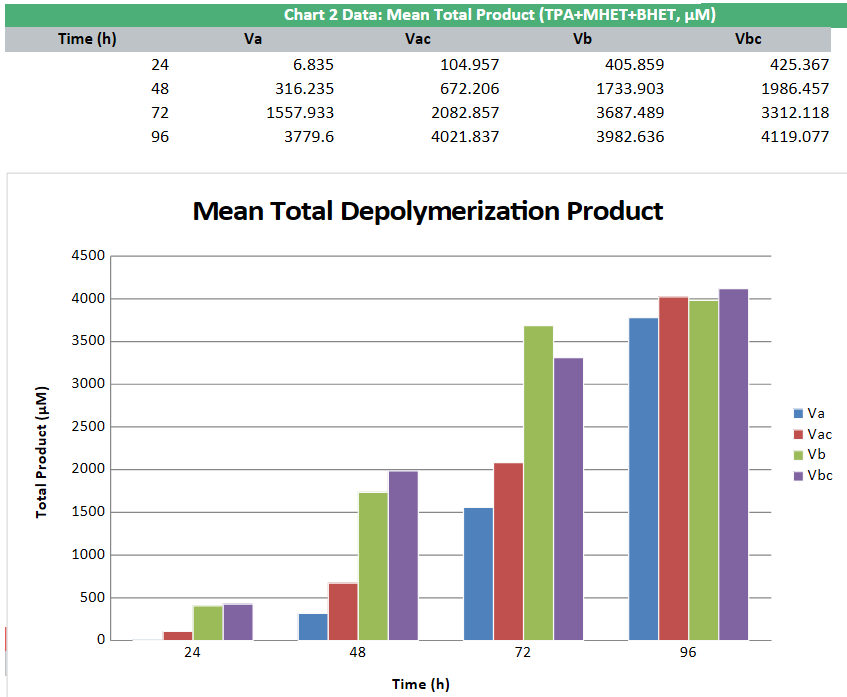
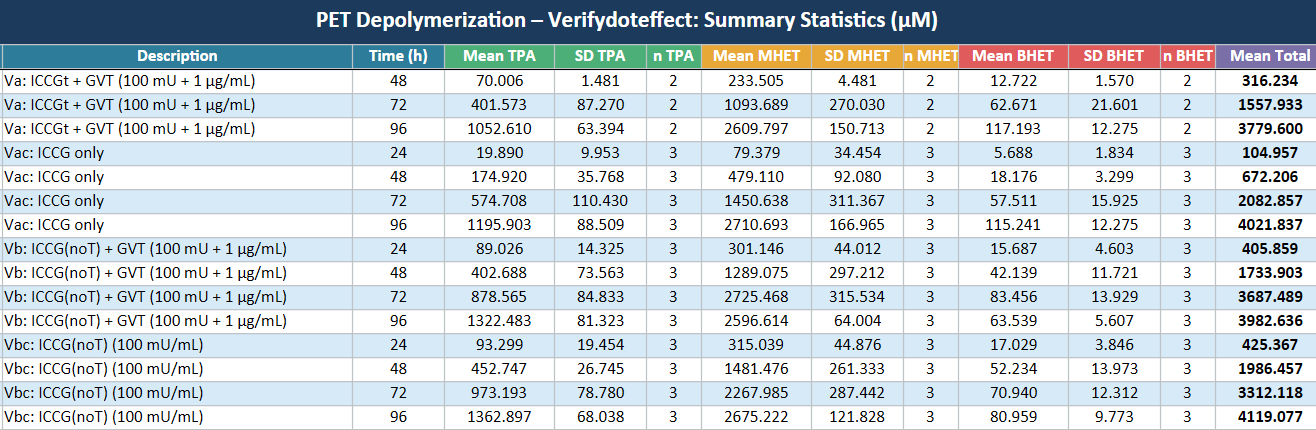
High-performance liquid chromatography (HPLC) was used to quantitatively identify and measure the concentrations of PET hydrolysis products, specifically bis(2-hydroxyethyl) terephthalate (BHET), mono(2-hydroxyethyl) terephthalate (MHET), and terephthalic acid (TPA). Measured hydrolysis products were released from amorphous PET (APET) film by ICCG-DoT. HPLC provides chromatographic separation of these structurally related products, allowing simultaneous identification by retention time and quantification by peak area integration.
Result: HPLC demonstrated that ICCG-DoT effectively depolymerizes APET film after 96 hours, generating predominantly MHET (67%) with TPA (32%) and trace amounts of BHET (1%). The predominance of MHET over TPA indicates that ICCG-DoT predominantly is active as a PETase, but has relatively little activity as an MHETase.
**still missing "standard curve of TPA" as described by Arvin.
Two Elements of Best Measurement
One excellent measurement was protein characterization: we used SDS-PAGE, Western Blot and quantitative analysis of purified protein by BSA assay. A second excellent measurement measured PETase activity: we used qualitative analysis and quantitative analysis to determine the activity of ICCG. Also, we have the standard curve of TPA.
Visit the Special Prizes page for more information.