Wet Lab Experiments
Wet Lab Lead: Christian. Christian led the team's cloning, protein expression, and enzyme assay work over several weeks, and prepared the detailed protocols and results below. This is the team's primary, most heavily-invested experimental work.
The experiment section includes the detailed procedures for cloning, enzyme assay, and protein expression. The central aim of the project is to engineer a cellulosome-inspired multi-enzyme complex, termed the PETosome, which co-localizes a dockerin-fused PET hydrolase (ICCG-DoT) and a dockerin-fused MHET hydrolase (TfCa-DoG) on a trimeric cohesin scaffold protein (ScafGVT) for synergistic and sequential degradation of PET into its constituent monomers, terephthalic acid (TPA) and ethylene glycol (EG).
Following amplification of the gene of interest by PCR and insertion into the pET28a plasmid vector backbone using the NEB Quick Ligation Kit, E. coli DH5α were transformed for plasmid propagation. Colony PCR and Sanger sequencing were then used to confirm the final insert, and BL21 E. coli were transformed for protein expression. Expression products were then purified by Ni-NTA IMAC and assessed for quality by SDS-PAGE; protein identity was confirmed using Western blot. Enzyme activity assays were then used to evaluate the PET-degrading performance of the recombinant constructs both qualitatively and quantitatively.
Part 1: Cloning
Protocol 1: PCR — Insert Amplification
1.1 Purpose
This protocol describes the amplification of target gene inserts — including ICCG, DockerinT, TfCa, DockerinG, TfCaWA, and ScafGVT coding sequences — using Q5® High-Fidelity DNA Polymerase (NEB #M0491). Q5 was selected for all insert amplification steps due to its ultra-high fidelity (~280× higher than Taq), which minimizes sequence errors in the final constructs prior to sequencing verification.
1.2 Materials
Reagents
- Q5® High-Fidelity DNA Polymerase (NEB #M0491)
- 5X Q5 Reaction Buffer (supplied with enzyme)
- 10 mM dNTP Solution Mix (NEB #N0447)
- 5X Q5 High GC Enhancer (optional; NEB #M0491, supplied with enzyme)
- 10 µM Forward Primer (gene-specific; see construct design notes)
- 10 µM Reverse Primer (gene-specific; see construct design notes)
- Template DNA (plasmid or synthetic gene block; < 1,000 ng per reaction)
- Nuclease-free Water (NEB #B1500)
Equipment
- Thermocycler with heated lid
- Sterile thin-walled 0.2 mL PCR tubes
- Microcentrifuge
- Ice bucket
1.3 Reaction Setup
Assemble all reaction components on ice. Mix each component gently before adding to the reaction tube. Add Q5 polymerase last. Collect all liquid to the bottom of the tube with a brief centrifuge spin before placing in the thermocycler.
| Component | 25 µl Reaction | 50 µl Reaction | Final Concentration |
|---|---|---|---|
| 5X Q5 Reaction Buffer | 5 µl | 10 µl | 1X |
| 10 mM dNTPs | 0.5 µl | 1 µl | 200 µM |
| 10 µM Forward Primer | 1.25 µl | 2.5 µl | 0.5 µM |
| 10 µM Reverse Primer | 1.25 µl | 2.5 µl | 0.5 µM |
| Template DNA | Variable | Variable | < 1,000 ng |
| Q5 High-Fidelity DNA Polymerase | 0.25 µl | 0.5 µl | 0.02 U/µl |
| 5X Q5 High GC Enhancer (optional) | (5 µl) | (10 µl) | (1X) |
| Nuclease-Free Water | To 25 µl | To 50 µl | — |
1.4 Thermocycling Conditions
| Step | Temperature | Time | Cycles |
|---|---|---|---|
| Initial Denaturation | 98°C | 30 seconds | 1 |
| Denaturation | 98°C | 5–10 seconds | 25–35 |
| Annealing | 50–72°C* | 10–30 seconds | 25–35 |
| Extension | 72°C | 20–30 sec/kb | 25–35 |
| Final Extension | 72°C | 2 minutes | 1 |
| Hold | 4–10°C | ∞ | — |
1.5 Step-by-Step Procedure
- Label PCR tubes and place on ice.
- Prepare a master mix on ice by combining, in order: nuclease-free water, 5X Q5 Reaction Buffer, dNTPs, forward primer, and reverse primer. Mix gently by pipetting.
- Add template DNA at the appropriate amount (1 pg–10 ng for plasmid; 1 ng–1 µg for genomic DNA).
- Add Q5 High-Fidelity DNA Polymerase last. Mix gently — do not vortex.
- Collect all liquid to the bottom of the tube with a brief (5 second) centrifuge spin.
- Transfer tubes immediately to a thermocycler preheated to 98°C and begin the thermocycling programme as specified in Section 1.4.
- After the programme is complete, hold at 4°C until ready to proceed to gel electrophoresis or downstream steps.
- Verify PCR product size by loading 5 µl of the PCR reaction with 6X loading dye on a 1% agarose gel and run at 100 V for 30 minutes alongside an appropriate DNA ladder.
- If the band of correct size is confirmed, purify the PCR product using the Monarch® Spin PCR & DNA Cleanup Kit (NEB #T1130) according to the manufacturer's protocol.
Protocol 2: Restriction Enzyme Digestion
2.1 Purpose
Restriction enzyme digestion is used to generate compatible cohesive ends on both the purified PCR insert and the linearised vector backbone (pET28a(+) or pKLAC2), enabling directional ligation. For all constructs in this project, double digestion with two restriction enzymes was performed to ensure directional cloning and to prevent vector self-ligation. The specific enzyme pairs used depended on the construct (e.g., XbaI/EcoRI-HF for ICCG-DoT cloning; see the construct-specific cloning schematic in the pptx results slides for details).
2.2 Materials
Reagents
- Restriction enzymes (NEB High-Fidelity series, e.g., XbaI-HF, EcoRI-HF, AvrII, SpeI-HF, DraIII-HF, ApaLI — selection dependent on construct)
- 10X CutSmart Buffer or appropriate NEBuffer (supplied with each enzyme)
- Purified PCR insert or plasmid DNA (≥ 1 µg)
- Nuclease-free Water (NEB #B1500)
- 6X Purple Loading Dye (NEB)
Equipment
- Heat block or water bath at 37°C
- Microcentrifuge
- Ice bucket
- 1.5 mL microcentrifuge tubes
2.3 Reaction Setup (50 µl)
Set up all reactions on ice. Restriction enzymes must always be added last.
| Component | Volume / Amount |
|---|---|
| Purified DNA | 1 µg |
| 10X NEBuffer (CutSmart or appropriate) | 5 µl (1X final) |
| Restriction Enzyme 1 | 1 µl |
| Restriction Enzyme 2 | 1 µl |
| Nuclease-free Water | To 50 µl |
2.4 Step-by-Step Procedure
- Assemble all components on ice in a 1.5 mL microcentrifuge tube. Add enzymes last.
- Mix gently by pipetting up and down 5–10 times. Briefly centrifuge to collect liquid at the bottom of the tube.
- Incubate at 37°C for 1–3 hours (or as recommended by the enzyme manufacturer for the specific enzyme pair used).
- Stop the reaction by adding 10 µl of 6X Purple Loading Dye (contains EDTA) if no further enzymatic manipulation is required.
- If further ligation is planned, remove enzyme by either: (a) heat inactivation at 65°C or 80°C for 20 minutes (verify enzyme-specific heat inactivation temperature), or (b) spin-column purification using the Monarch® Spin DNA Cleanup Kit (NEB #T1120).
- Verify digestion by running 5 µl of the reaction on a 1% agarose gel alongside a 1 kb DNA ladder. Confirm that the expected fragment sizes match the in silico digest prediction from NEBcloner.
- Purify the digested vector backbone by gel extraction using the Monarch® Spin DNA Gel Extraction Kit (NEB #T1120) to isolate the correct band and remove undigested or incomplete digest products.
Protocol 3: DNA Ligation
3.1 Purpose
Following restriction enzyme digestion, the digested insert and linearised vector backbone are joined using the NEB Quick Ligation™ Kit (NEB #M2200). This kit enables efficient ligation of cohesive-end DNA fragments within 5 minutes at room temperature, making it suitable for high-throughput cloning workflows.
3.2 Materials
- Quick Ligation™ Kit (NEB #M2200): contains Quick Ligase Reaction Buffer (2X) and Quick Ligase enzyme
- Purified, restriction-digested vector DNA
- Purified, restriction-digested insert DNA
- Nuclease-free Water (NEB #B1500)
- Ice bucket
3.3 Reaction Setup (20 µl)
Set up the reaction in a 1.5 mL microcentrifuge tube on ice. Add Quick Ligase last.
| Component | Volume | Final Amount |
|---|---|---|
| Quick Ligase Reaction Buffer (2X) | 10 µl | 1X |
| Vector DNA | X µl | 50 ng (0.020 pmol for 4 kb vector) |
| Insert DNA | X µl | 37.5 ng (0.060 pmol for 1 kb insert) |
| Quick Ligase | 1 µl | — |
| Nuclease-free Water | To 20 µl | — |
3.4 Step-by-Step Procedure
- Thaw Quick Ligase Reaction Buffer (2X) at room temperature. Vortex briefly to fully resuspend.
- Calculate the volumes of vector and insert DNA needed using the NEBioCalculator, targeting a 1:3 molar ratio.
- Assemble all components in a 1.5 mL microcentrifuge tube on ice in the order listed in Section 3.3. Add Quick Ligase last.
- Mix gently by pipetting up and down. Briefly centrifuge to collect liquid at the bottom of the tube.
- Incubate at room temperature (25°C) for exactly 5 minutes. Do not exceed this time, as transformation efficiency decreases with prolonged incubation.
- Place on ice immediately after incubation. Proceed to transformation within 30 minutes, or store at −20°C for later use.
Protocol 4: Bacterial Transformation
4.1 Purpose
The ligation product is introduced into chemically competent E. coli cells by heat-shock transformation. Transformed cells are plated onto selective antibiotic media and incubated overnight to allow single colony formation. For routine cloning and plasmid propagation, E. coli DH5α competent cells were used. For protein expression experiments, E. coli BL21(DE3) or BL21 Rosetta™ DE3 strains were used (see protein expression protocols).
4.2 Materials
- Chemically competent E. coli cells (e.g., NEB 5-alpha or DH5α; stored at −80°C)
- Ligation product (from Protocol 3)
- SOC medium or LB broth (room temperature)
- LB agar plates with appropriate antibiotic selection (e.g., Kanamycin 50 µg/mL for pET28a(+) constructs; Ampicillin 100 µg/mL for pKLAC2 constructs)
- 42°C heat block or water bath
- 37°C incubator (for plates)
- 37°C shaking incubator (250 rpm)
- 1.5 mL microcentrifuge tubes
- Ice bucket
4.3 Step-by-Step Procedure
- Remove competent cells from −80°C storage and thaw on ice for 10–15 minutes. Do not allow cells to warm above 4°C before use.
- Chill 1.5 mL microcentrifuge tubes on ice. Add 2 µl (~5 ng) of the ligation product to a pre-chilled tube.
- Add 50 µl of competent cells directly to the DNA. Mix gently by pipetting up and down 4–5 times or by flicking the tube. Do not vortex.
- Incubate on ice for 30 minutes without agitation.
- Heat shock at 42°C for exactly 30 seconds. Do not mix during heat shock.
- Return immediately to ice for 2 minutes.
- Add 950 µl of room temperature SOC medium (or LB broth) to the tube.
- Incubate at 37°C for 60 minutes with vigorous shaking (250 rpm) to allow recovery and antibiotic resistance expression.
- Pre-warm antibiotic selection plates to 37°C during the recovery incubation.
- Spread 50–100 µl of the transformation mixture evenly onto the pre-warmed selection plates using a sterile spreader or glass beads.
- Invert plates and incubate at 37°C overnight (16–18 hours).
- The following morning, inspect plates for colony growth. Individual colonies indicate successful transformation and should be picked for colony PCR screening (Protocol 5).
Protocol 5: Colony PCR Screening
5.1 Purpose
Colony PCR is used to rapidly screen transformed colonies for the presence of the correctly inserted gene of interest prior to miniprep and sequencing. Taq 2X Master Mix (NEB #M0270) is used for colony PCR, as the dA-overhang products generated are compatible with downstream subcloning if needed, and the cost-effectiveness of Taq is appropriate for high-throughput screening. Primer pairs flanking the insert-vector junction are used for confirmation.
5.2 Materials
- Taq 2X Master Mix (NEB #M0270)
- 10 µM Forward Primer (vector-specific or gene-specific flanking primer)
- 10 µM Reverse Primer (vector-specific flanking primer)
- Nuclease-free Water (NEB #B1500)
- Sterile toothpicks or inoculation loops for colony picking
- LB broth with appropriate antibiotic (for overnight culture of positive clones)
- 0.2 mL PCR tubes
- Thermocycler with heated lid
5.3 Reaction Setup (25 µl per colony)
| Component | Volume | Final Concentration |
|---|---|---|
| Taq 2X Master Mix | 12.5 µl | 1X |
| 10 µM Forward Primer | 0.5 µl | 0.2 µM |
| 10 µM Reverse Primer | 0.5 µl | 0.2 µM |
| Nuclease-free Water | 11.5 µl | — |
| Colony (template) | — | Direct inoculation |
5.4 Step-by-Step Procedure
- Prepare a master mix (without template) for the total number of colonies to be screened, plus one extra reaction for the no-template negative control.
- Aliquot 25 µl of master mix into labelled 0.2 mL PCR tubes.
- Using a sterile toothpick or pipette tip, gently touch a single colony and swirl the tip in one PCR reaction tube. Dip the same toothpick/tip into a corresponding tube of LB broth with antibiotic for overnight backup culture.
- Repeat Step 3 for each colony to be screened (typically 8–16 colonies per construct).
- Include a no-template negative control reaction.
- Place tubes in the thermocycler and run the following programme:
| Step | Temperature | Time | Cycles |
|---|---|---|---|
| Initial Denaturation (cell lysis) | 95°C | 5 minutes | 1 |
| Denaturation | 95°C | 15–30 seconds | 30 |
| Annealing | 45–68°C* | 15–60 seconds | 30 |
| Extension | 68°C | 1 min/kb | 30 |
| Final Extension | 68°C | 5 minutes | 1 |
| Hold | 4–10°C | ∞ | — |
- After the programme completes, load 5 µl of each PCR product with 1 µl of 6X loading dye on a 1% agarose gel. Run at 100 V for 30 minutes.
- Identify positive colonies as those showing a band at the expected insert size. Negative colonies will show no band or a band at a different size.
- Inoculate overnight liquid cultures from positive colony backup tubes (from Step 3) in LB broth with antibiotic at 37°C, 250 rpm, for 16 hours.
- Use overnight cultures for plasmid miniprep (Protocol 6).
Protocol 6: Plasmid Miniprep
6.1 Purpose
Plasmid DNA is isolated from overnight E. coli cultures of colony PCR-positive clones using the Geneaid High-Speed Plasmid Mini Kit. The isolated plasmid DNA is then subjected to Sanger sequencing to confirm the correct sequence of the insert and its junction with the vector.
6.2 Materials
- Geneaid High-Speed Plasmid Mini Kit (Cat. No. PD100/PD300): contains PD1, PD2, PD3, W1, and Wash Buffers; Elution Buffer; PD spin column; 2 mL collection tubes
- RNase A (50 mg/mL; added to PD1 Buffer before first use)
- Absolute ethanol (added to Wash Buffer before first use; see bottle label for volume)
- Overnight E. coli culture (1.5–4 mL)
- Microcentrifuge (capable of 14,000–16,000 × g)
- 1.5 mL microcentrifuge tubes
6.3 Step-by-Step Procedure
Step 1 — Harvesting
- Transfer 1.5 mL of overnight bacterial culture to a 1.5 mL microcentrifuge tube.
- Centrifuge at 14,000–16,000 × g for 1 minute. Discard supernatant completely by inverting and blotting on clean tissue.
- If more than 1.5 mL of culture is needed (for higher yield), repeat the harvesting step by adding a second aliquot to the same pellet and centrifuging again.
Step 2 — Resuspension
- Add 200 µl of PD1 Buffer (with RNase A added) to the bacterial pellet.
- Resuspend the pellet completely by vortexing or pipetting until no cell clumps remain.
Step 3 — Lysis
- Add 200 µl of PD2 Buffer. Mix by inverting the tube 10 times. Do not vortex (vortexing will shear genomic DNA, leading to contamination).
- Allow the mixture to stand at room temperature for 2 minutes (minimum). Do not exceed 5 minutes, as prolonged lysis can degrade plasmid DNA.
Step 4 — Neutralisation
- Add 300 µl of PD3 Buffer. Mix immediately by inverting the tube 10 times. Do not vortex.
- Centrifuge at 14,000–16,000 × g for 3 minutes. A white precipitate (denatured genomic DNA and cell debris) should pellet at the bottom of the tube.
Step 5 — DNA Binding
- Place a PD spin column in a 2 mL collection tube.
- Carefully transfer the supernatant from Step 4 to the PD column, avoiding the white pellet.
- Centrifuge at 14,000–16,000 × g for 30 seconds. Discard the flow-through.
- Place the PD column back into the 2 mL collection tube.
Step 6 — Wash (Optional W1 Wash for Sequencing)
- (Recommended for sequencing-grade purity) Add 400 µl of W1 Buffer to the PD column. Centrifuge at 14,000–16,000 × g for 30 seconds. Discard flow-through. Place the PD column back in the collection tube.
- Add 600 µl of Wash Buffer (with ethanol added) to the PD column. Centrifuge at 14,000–16,000 × g for 30 seconds. Discard flow-through.
- Place the PD column back in the collection tube. Centrifuge at 14,000–16,000 × g for 3 minutes to completely dry the column matrix and remove residual ethanol.
Step 7 — DNA Elution
- Transfer the PD column to a new, labelled 1.5 mL microcentrifuge tube.
- Add 50 µl of Elution Buffer (or nuclease-free water) directly onto the centre of the PD column matrix. Allow to stand at room temperature for at least 2 minutes to maximise absorption and elution efficiency.
- Centrifuge at 14,000–16,000 × g for 2 minutes to elute the purified plasmid DNA.
- (Optional) For increased yield: transfer the eluate back onto the centre of the column matrix, allow to stand for 1 minute, and centrifuge again.
- Measure the DNA concentration and purity using a spectrophotometer (e.g., NanoDrop or Bioanalytical). Record the A260/A280 ratio (acceptable range: 1.7–1.9) and concentration (ng/µl).
- Submit plasmid DNA for Sanger sequencing using appropriate sequencing primers to confirm correct insert sequence and vector junction.
Summary: Plasmid Construction Pipeline
The table below summarises the key parameters for each protocol in the plasmid construction workflow.
| Protocol | Purpose | Key Reagent / Kit | Critical Parameter |
|---|---|---|---|
| 1. PCR (Insert Amplification) | Amplify gene insert with high fidelity | Q5® Polymerase (NEB #M0491) | Extension time: 20–30 sec/kb; Tm via NEB Calculator |
| 2. Restriction Enzyme Digestion | Generate compatible cohesive ends | HF Restriction Enzymes (NEB) | Double digest; verify with NEBcloner; 1 µg DNA per reaction |
| 3. Ligation | Join insert and vector | Quick Ligation™ Kit (NEB #M2200) | 5 min at 25°C; 1:3 vector:insert molar ratio |
| 4. Transformation | Introduce construct into E. coli | Competent E. coli (DH5α) | 30 sec heat shock at 42°C; 60 min recovery at 37°C |
| 5. Colony PCR | Screen colonies for correct insert | Taq 2X Master Mix (NEB #M0270) | 5 min initial denaturation at 95°C; check band at expected bp |
| 6. Miniprep & Sequencing | Purify plasmid; confirm sequence | Geneaid High-Speed Plasmid Mini Kit | A260/A280 = 1.7–1.9; submit for Sanger sequencing |
Part 2: Protein Expression
Protocol 7: Recombinant Protein Expression in E. coli
7.1 Purpose
This protocol describes IPTG-inducible expression of 8×His-tagged recombinant proteins from pET28a(+)-based constructs in E. coli. Expression conditions (strain, temperature, IPTG concentration, induction time, and growth medium) were optimised individually for each construct to maximise soluble protein yield. The specific conditions used for each construct are summarised in Section 7.4.
7.2 Materials
Reagents
- E. coli expression strain (see Section 7.4 for strain per construct)
- LB broth (for starter culture) or Terrific Broth (TB) as specified per construct
- LB broth supplemented with 2 mM CaCl2 (for TfCa-DoG expression)
- Appropriate antibiotic: Kanamycin (50 µg/mL) for pET28a(+) constructs
- IPTG (isopropyl β-D-1-thiogalactopyranoside) stock solution: 1 M in sterile water, stored at −20°C
- Sterile conical flasks (250 mL or 500 mL)
Equipment
- Spectrophotometer (for OD600 measurement)
- Orbital shaking incubator (capable of 37°C and 16–18°C)
- Refrigerated centrifuge
- 50 mL conical tubes or 250 mL centrifuge bottles
7.3 General Step-by-Step Procedure
- Inoculate a single colony of the expression strain carrying the target plasmid into 5 mL LB broth with the appropriate antibiotic. Incubate overnight (16–18 hours) at 37°C with shaking at 250 rpm as a starter culture.
- The following morning, dilute the overnight starter culture 1:100 into fresh expression medium (see Section 7.4 for medium per construct) supplemented with antibiotic in a sterile conical flask. Use a culture volume of no more than 20% of the flask volume to ensure adequate aeration.
- Grow at 37°C with shaking at 250 rpm. Monitor OD600 every 30–60 minutes using a spectrophotometer.
- When the OD600 reaches 0.6–0.8 (mid-log phase), induce protein expression by adding IPTG to the final concentration specified in Section 7.4. Mix well by swirling the flask.
- Reduce the incubation temperature (if applicable; see Section 7.4) and continue shaking for the induction duration specified per construct.
- After induction, transfer the culture to appropriate centrifuge tubes. Harvest cells by centrifugation at 4,000–5,000 × g for 15 minutes at 4°C.
- Discard the supernatant. The cell pellet can be immediately processed for lysis (Protocol 8) or snap-frozen in liquid nitrogen and stored at −80°C for later use.
NOTE: Collect a 1 mL pre-induction sample (aliquot) and 1 mL post-induction samples at each time point into individual 1.5 mL microcentrifuge tubes. Centrifuge at 13,000 × g for 10 minutes, aspirate supernatant, and store pellets at −70°C for SDS-PAGE analysis of expression levels over time.
7.4 Construct-Specific Expression Conditions
| Construct | Expression Strain | Growth Medium | Induction Temp. | IPTG Conc. | Induction Time |
|---|---|---|---|---|---|
| ICCG-DoT (PETase; 39.9 kDa) | E. coli BL21 Rosetta™ DE3 | Terrific Broth (TB) | 37°C | 0.5 mM (at OD600 0.6–0.8) | 24 hr |
| TfCa-DoG (MHETase; 64.79 kDa) | E. coli BL21 DE3 | LB + 2 mM CaCl2 | 18°C | 5 mM (at OD600 0.6–0.8) | 15 hr |
| ScafGVT (Scaffold; 58.96 kDa) | E. coli BL21 DE3 | LB broth | 16°C | 0.2 mM (at OD600 0.6–0.8) | 19 hr |
NOTE: The use of E. coli BL21 Rosetta™ DE3 for ICCG-DoT expression provides extra tRNAs for rare codons present in the ICCG sequence derived from Leaf-Branch Compost Cutinase (LCCICCG).
NOTE: The low induction temperature for TfCa-DoG (18°C) and ScafGVT (16°C) promotes slower protein synthesis, reducing the risk of inclusion body formation and improving soluble protein yield.
NOTE: Supplementation of 2 mM CaCl2 in the TfCa-DoG expression medium supports correct folding of the TfCa (TfCut2) domain, which has a calcium-binding site required for thermostability.
Protocol 8: Bacterial Cell Lysis by Sonication
8.1 Purpose
Following harvest, bacterial cell pellets are lysed to release soluble recombinant protein for downstream affinity purification. Lysis is achieved by resuspension in a detergent-containing lysis buffer followed by probe sonication. Sonication mechanically disrupts cell membranes and reduces lysate viscosity by shearing chromosomal DNA.
8.2 Materials
Lysis Buffer Composition (per 10 mL)
Prepare fresh on the day of use. Add lysozyme and PMSF immediately before use. Add DNase only after sonication.
| Component | Final Concentration / Amount | Notes |
|---|---|---|
| Tris-HCl pH 8.0 | 50 mM (0.060 g per 10 mL) | Adjust pH to 8.0 |
| Glycerol | 10% (v/v) | Stabilises protein; prevents aggregation |
| Triton X-100 | 0.1% (v/v) | Non-ionic detergent; aids membrane disruption |
| Lysozyme | 0.001 g per 10 mL (~0.1 mg/mL) | Add fresh; assists cell wall digestion |
| PMSF | 1 mM | Serine protease inhibitor; add fresh from 100 mM stock in ethanol |
| MgCl2 | 2 mM (0.002 g per 10 mL) | Cofactor for DNase activity |
| DNase I | ~2% of final volume | Add AFTER sonication to digest released chromosomal DNA |
CAUTION: Do not add EDTA to this lysis buffer. EDTA chelates Ni2+ ions and will interfere with downstream His-tag affinity purification.
CAUTION: PMSF is toxic and unstable in aqueous solution. Prepare a 100 mM stock in absolute ethanol and add to the lysis buffer immediately before use.
8.3 Sonication Instrument Settings
The following settings apply to a standard probe sonicator (e.g., Branson or equivalent) for a sample volume of 0.5–1 mL resuspended in a 1.5 mL microcentrifuge tube.
| Parameter | Setting |
|---|---|
| Timer per pulse | 30 seconds |
| Pulse cycle ON | 5 seconds |
| Pulse cycle OFF | 5 seconds |
| Amplitude | 37% (do not exceed 40%) |
| Number of pulses | 3 × 30 seconds (9 pulses total per sample) |
| Interval between samples | 20 seconds (probe rested in ice) |
8.4 Step-by-Step Procedure
Preparation
- Resuspend the bacterial cell pellet in 1 mL of freshly prepared lysis buffer per 1.5 mL of original overnight culture pellet. Pipette thoroughly to fully resuspend.
- Transfer the resuspended pellet into a 15 mL conical tube (if pooling multiple aliquots). Incubate on ice for 30 minutes to allow lysozyme to digest the cell wall.
Sonication
- Set the sonicator to the parameters in Section 8.3: Timer 30 s, Pulse ON 5 s / OFF 5 s, Amplitude 37%.
- Place the sample tube in an ice bucket. Immerse the sonicator probe fully into the sample. The probe tip must not touch the sides or bottom of the tube.
- Press Start. Perform 3 consecutive 30-second pulse cycles per sample.
- Between samples (or between pulse cycles if the sample heats up), rest the probe in ice for at least 20 seconds to prevent sonicator overheating.
- Monitor the sample throughout sonication: the lysate should gradually transition from turbid/viscous to translucent as cells are disrupted and chromosomal DNA is sheared.
- After each session, record the total energy output (Joules) displayed on the sonicator screen. Note any differences between the first and last tubes in a batch as a quality check.
NOTE: If the sample becomes warm during sonication, extend the rest period between pulses. Protein integrity is compromised if the sample temperature rises above ~10°C.
NOTE: For sample volumes larger than 10 mL, replace the sonicator probe with a larger-volume tip suitable for the increased volume. Using a small tip on a large volume reduces sonication efficiency and may damage the probe.
Post-Sonication Clarification
- After sonication, add DNase I to the lysate. Mix gently and incubate on ice for 10 minutes to digest chromosomal DNA and reduce viscosity.
- Centrifuge the lysate at 13,000 × g for 20 minutes at 4°C.
- Carefully transfer the clarified supernatant (soluble fraction) to a new pre-chilled 1.5 mL or 15 mL tube. Avoid disturbing the pellet (insoluble fraction / inclusion bodies).
- Reserve 100 µl of the clarified supernatant for SDS-PAGE analysis (add 25 µl of 5X SDS sample buffer, boil at 95°C for 10 minutes). Store the remainder on ice or at −20°C until proceeding to purification.
Protocol 9: His-Tag Affinity Purification by Ni-NTA IMAC
9.1 Purpose
Recombinant 8×His-tagged proteins are purified from clarified cell lysates by immobilised metal affinity chromatography (IMAC) using PureCube 100 INDIGO Ni-Agarose resin (Cube Biotech, Cat. No. 75103/75105). The polyhistidine tag binds selectively to Ni2+ ions chelated on the resin. Non-specifically bound contaminants are removed by stepwise imidazole washes, and the target protein is eluted at high imidazole concentration. Imidazole wash concentrations were optimised empirically for each construct based on preliminary purification tests (see demo data).
9.2 Materials
- PureCube 100 INDIGO Ni-Agarose resin (Cube Biotech), 50% (v/v) suspension in 20% ethanol — stored at 4°C
- Gravity-flow chromatography column (e.g., Bio-Rad Poly-Prep or equivalent)
- Equilibration / Binding buffer: 1× PBS pH 7.4 + 10–40 mM imidazole (see Section 9.4 for construct-specific concentrations)
- Wash buffers: 1× PBS pH 7.4 + 25–90 mM imidazole (stepwise; see Section 9.4)
- Elution buffer: 1× PBS pH 7.4 + 250 mM imidazole
- High-elution buffer (for TfCa-DoG): 1× PBS pH 7.4 + 300–500 mM imidazole
- Dialysis buffer: 50 mM Tris-HCl pH 7.5, 150 mM NaCl, 10% glycerol (for post-elution dialysis)
- Dialysis tubing or spin concentrator (appropriate MWCO)
- Microcentrifuge tubes (1.5 mL) for fraction collection
9.3 Resin Properties (PureCube 100 INDIGO Ni-Agarose)
| Property | Specification |
|---|---|
| Bead size | 100 µm (particle diameter 50–150 µm) |
| Binding capacity | Up to 100 mg protein/mL resin (tested with 6×His-eGFP) |
| Metal ion capacity | > 75 µeqv Ni2+/mL resin |
| Chelator stability | Stable in up to 20 mM DTT and 20 mM EDTA |
| Suspension form | 50% (v/v) suspension; 2 mL suspension = 1 mL bed volume |
| Storage | 4°C in neutral buffer with 20% ethanol (long-term) |
| pH compatibility | pH 4–13 |
9.4 Construct-Specific Imidazole Wash Conditions
The imidazole concentration gradient used for washing was optimised to balance removal of non-specifically bound host proteins while retaining the target His-tagged protein on the resin. The following conditions were used:
| Construct | Equilibration | Wash 1 | Wash 2 | Elution 1 | Elution 2 |
|---|---|---|---|---|---|
| ICCG-DoT (39.9 kDa) | 10 mM | 50 mM | 90 mM | 250 mM | 250 mM |
| TfCa-DoG (64.79 kDa) | 10 mM | 50 mM | 70–90 mM | 250 mM | 300–500 mM |
| ScafGVT (58.96 kDa) | 10 mM | 50 mM | 90 mM | 250 mM | 250 mM |
NOTE: All buffers were prepared in 1× PBS pH 7.4 with the indicated imidazole concentration. A more stringent wash (higher imidazole in equilibration buffer, e.g., 40 mM) can be used to reduce background, as demonstrated in preliminary purification trials. However, the 10 mM equilibration / 250 mM elution scheme was adopted as the standard condition for these constructs.
9.5 Step-by-Step Procedure
Column Preparation
- Resuspend the INDIGO Ni-Agarose resin by gentle inversion. Pipette 2 mL of resin suspension (= 1 mL bed volume) into the gravity-flow column. Allow the resin to settle and the storage buffer to drain by gravity.
- Wash the resin with 5 column volumes (CV) of equilibration buffer (1× PBS + 10 mM imidazole) to remove ethanol storage buffer and pre-equilibrate the resin.
Sample Loading
- Apply the clarified cell lysate (from Protocol 8, Step 12) onto the pre-equilibrated column. Allow the lysate to flow through by gravity.
- Collect the flow-through fraction in a labelled 1.5 mL tube. Reserve for SDS-PAGE analysis.
Washing
- Apply Wash 1 buffer (2 mL; 50 mM imidazole) to the column. Collect the wash fraction. Repeat 2–3 times as needed (total 4–6 mL).
- Apply Wash 2 buffer (2 mL; 70–90 mM imidazole depending on construct; see Section 9.4). Collect the wash fraction.
- Reserve all wash fractions in labelled 1.5 mL tubes for SDS-PAGE analysis to track protein recovery.
Elution
- Apply Elution buffer (2 mL; 250 mM imidazole) to the column. Collect the eluate in a labelled 1.5 mL tube (Elution 1). Repeat to collect Elution 2 (further 2 mL).
- For TfCa-DoG, apply an additional higher-concentration elution (300 mM, then 500 mM imidazole, 2 mL each) to ensure complete recovery.
- Reserve 45–50 µl of each fraction (lysate, flow-through, each wash, each elution) for SDS-PAGE and Western blot analysis (Protocols 10 and 11).
Dialysis and Concentration
- Pool elution fractions containing the target protein (identified by SDS-PAGE). Transfer to dialysis tubing (MWCO appropriate for protein size).
- Dialyse against dialysis buffer (50 mM Tris-HCl pH 7.5, 150 mM NaCl, 10% glycerol) at 4°C overnight with at least two buffer changes to remove imidazole.
- Concentrate the dialysed protein using a spin concentrator (appropriate MWCO). Measure final protein concentration using the Pierce BCA Protein Assay Kit (see Section 9.6). Store the purified, dialysed protein at −80°C in small aliquots to avoid repeated freeze-thaw cycles.
9.6 Protein Quantification — Pierce BCA Assay
Protein concentration of purified fractions is determined using the Pierce® BCA Protein Assay Kit (Thermo Scientific), based on the colorimetric reduction of Cu2+ to Cu+ by protein in alkaline conditions, forming a purple chelate complex detectable at 562 nm.
- Prepare BSA standard dilutions in PBS from the 2 mg/mL stock: 0, 0.1, 0.2, 0.3, 0.4, 0.5, 1.0, and 2.0 mg/mL.
- Dilute protein samples as appropriate (intracellular proteins: ≥ 5-fold; secreted/purified proteins: ≥ 10-fold) to bring within the standard curve range (0–2 mg/mL).
- Mix BCA Reagent A and B in a 50:1 ratio (200 µl total per reaction).
- Add 10 µl of each standard and sample to 200 µl of BCA working reagent. Mix well.
- Incubate at 37°C for 30 minutes.
- Transfer 200 µl of each reaction to a 96-well plate. Read absorbance at 562 nm using an ELISA microplate reader.
- Calculate protein concentration from the BSA standard curve.
Protocol 10: SDS-PAGE and Coomassie Blue Staining
10.1 Purpose
SDS-PAGE (sodium dodecyl sulphate–polyacrylamide gel electrophoresis) is used to assess the molecular weight, purity, and relative abundance of proteins across all purification fractions. Coomassie Blue R-250 staining provides total protein visualisation. For each construct, 10% polyacrylamide separating gels were used, providing optimal resolution in the 18–75 kDa range — appropriate for ICCG-DoT (39.9 kDa), TfCa-DoG (64.79 kDa), and ScafGVT (58.96 kDa).
10.2 Gel Preparation
Separating Gel (10 mL, 10% acrylamide — for 0.75–1 mm spacer plates, two gels)
| Component | 8% | 10% | 12% | 15% |
|---|---|---|---|---|
| 4X Lower Gel Buffer (mL) | 2.5 | 2.5 | 2.5 | 2.5 |
| ddH2O (mL) | 5.4 | 4.9 | 4.4 | 3.65 |
| 40% 29:1 Acrylamide/Bis (mL) | 2.0 | 2.5 | 3.0 | 3.75 |
| 10% Ammonium Persulfate (mL) | 0.15 | 0.15 | 0.15 | 0.15 |
| TEMED (mL) | 0.01 | 0.01 | 0.01 | 0.01 |
| Optimal resolution range | 30–120 kDa | 18–75 kDa | 15–60 kDa | 15–45 kDa |
Stacking Gel (5 mL, 4%)
| Component | Volume |
|---|---|
| 4X Upper Gel Buffer | 1.25 mL |
| ddH2O | 3.3 mL |
| 40% 29:1 Acrylamide/Bis | 0.4 mL |
| 10% Ammonium Persulfate | 0.1 mL |
| TEMED | 0.008 mL |
Buffer Recipes
- 4X Lower Gel Buffer (1 L): 1.5 M Tris-HCl pH 8.8 (181.71 g Tris) + 0.4% SDS (4 g). Adjust to pH 8.8, add water to 1 L.
- 4X Upper Gel Buffer (1 L): 0.5 M Tris-HCl pH 6.8 (60.55 g Tris) + 0.4% SDS (4 g). Adjust to pH 6.8, add water to 1 L.
- 10X Running Buffer (1 L): 0.25 M Tris-base (30.3 g) + 1.92 M Glycine (144 g) + 1% SDS (10 g). Add water to 1 L. Dilute 1:10 before use.
10.3 Sample Preparation
- Prepare 5X SDS Sample Buffer stock: NaH2PO4 (0.17 g), Na2HPO4 (0.51 g), SDS (0.5 g), Urea (18 g), Bromophenol Blue (0.008 g) in 50 mL water. Store protected from light at 4°C.
- For use: combine 900 µl sample buffer stock + 100 µl glycerol + 10 µl 2-mercaptoethanol. Prepare 1 mL working solution fresh on day of use.
- Mix protein sample with 5X SDS sample buffer in a ratio of 4:1 (v/v) (e.g., 40 µl sample + 10 µl buffer). Protein load per well: 35–45 µl per well as specified per construct in the results section.
- Boil at 95°C for 5–10 minutes to denature proteins and ensure complete SDS binding.
- Briefly centrifuge to collect condensation. Load samples immediately onto the gel or store at −20°C.
10.4 Electrophoresis
- Assemble the gel cassette. Check for leaks using ddH2O before adding gel solution.
- Pour the separating gel (approximately 2/3 to 3/4 of the cassette height). Overlay with isopropanol or ddH2O to create a flat surface. Allow to polymerise for 15–30 minutes.
- Remove the isopropanol overlay. Pour the stacking gel and insert the comb immediately. Allow to polymerise for 15–30 minutes.
- Place the gel in the electrophoresis tank. Fill the inner chamber completely and the outer chamber to at least above the electrode wire with 1X Running Buffer (~400 mL total).
- Load 4 µl of pre-stained protein ladder (e.g., PageRuler™ Prestained Protein Ladder, Fermentas) and prepared samples into wells.
- Run at 80 V until samples enter the separating gel (approximately 20–30 minutes), then increase to 100 V for approximately 2 hours until the dye front reaches the bottom of the gel.
- Turn off the power supply. Remove the gel carefully from the cassette. Discard the stacking gel.
10.5 Coomassie Blue Staining
Staining Solution (1 L): Coomassie Blue R-250 (1 g) + Methanol (450 mL) + ddH2O (450 mL) + Glacial Acetic Acid (100 mL)
Destaining Solution (1 L): Methanol (500 mL) + Acetic Acid (100 mL) + ddH2O (400 mL)
- Transfer the gel to a clean container. Add sufficient Coomassie Blue staining solution to cover the gel.
- Place on an orbital shaker at room temperature for 10 minutes.
- Remove and recycle the staining solution (reusable). Add sufficient Destaining solution to cover the gel. Place a folded paper towel in the container to absorb released dye. Shake overnight at room temperature.
- Remove the gel from the destaining solution. Visualise and photograph under white light. Wrap in cling film for storage.
Protocol 11: Immunoblot (Western Blot)
11.1 Purpose
Immunoblotting confirms the identity of the expressed recombinant His-tagged protein by detection with an anti-His-tag antibody. Following SDS-PAGE, proteins are transferred to a PVDF membrane and probed sequentially with primary (anti-His) and secondary (HRP-conjugated) antibodies. Signal is visualised by enhanced chemiluminescence (ECL).
11.2 Antibodies Used
| Antibody | Host | Specificity | Dilution | Source |
|---|---|---|---|---|
| Primary: Rabbit anti-His Tag Ab (LTK BioLaboratories) | Rabbit | 8×His tag | 1:1000 | LTK BioLaboratories |
| Secondary: Goat anti-rabbit IgG-HRP | Goat | Rabbit IgG | 1:1000 | Standard commercial supplier |
NOTE: Antibody information used in this project: 1° Ab — Rabbit anti-His Ab (LTK BioLaboratories), 1:1000 dilution in TTBS. 2° Ab — Goat anti-rabbit IgG-HRP, 1:1000 dilution in TTBS.
11.3 Buffer Recipes
- 10X TBS Buffer (2 L): NaCl (amount per lab protocol) + KCl (4 g) + Tris-base (60 g). Adjust to pH 7.4, add water to 2 L.
- 1X TBS: 100 mL 10X TBS + 900 mL ddH2O.
- TTBS (Tween-TBS): 999 mL 1X TBS + 1 mL Tween-20 (final 0.1%).
- 5% Blocking Milk: 1 g non-fat dried milk (e.g., Anchor skimmed milk powder) dissolved in 20 mL TTBS.
- 10X Transfer Buffer (2 L): 0.25 M Tris-base (60.57 g) + 1.92 M Glycine (288 g). Add water to 2 L.
- 1X Transfer Buffer (1 L): 100 mL 10X Transfer Buffer + 700 mL ddH2O + 200 mL methanol.
11.4 Step-by-Step Procedure
Protein Transfer to PVDF Membrane
- After SDS-PAGE (Protocol 10), cut the PVDF membrane slightly larger than the gel. Pre-wet the PVDF membrane in 100% methanol for 1 minute, then equilibrate in 1X Transfer Buffer for 2 minutes.
- Soak filter papers (2–3 sheets per side) in 1X Transfer Buffer.
- Assemble the transfer sandwich in the following order (from black/anode side): sponge → filter paper(s) → gel → PVDF membrane → filter paper(s) → sponge. Note: proteins migrate from cathode (−) to anode (+), so the gel must face the black (negative) side and the membrane must face the clear (positive) side.
- Using a roller or pipette, firmly expel all air bubbles between each layer. Air bubbles cause blank spots on the membrane.
- Close the transfer cassette securely. Insert into the transfer tank filled with cold 1X Transfer Buffer containing an ice block.
- Transfer at constant current: 300 mA for 2 hours at 4°C (or alternatively 60 mA overnight). Keep the transfer buffer cold throughout.
Blocking
- After transfer, remove the PVDF membrane and place in a clean container.
- Add freshly prepared 5% blocking milk (in TTBS). Incubate at room temperature for 40 minutes on an orbital shaker.
- Wash the membrane with TTBS three times, 10 minutes per wash, on an orbital shaker.
Primary Antibody Incubation
- Dilute primary antibody (anti-His, LTK BioLaboratories) 1:1000 in TTBS (or in 5% blocking milk for reduced background).
- Add the diluted primary antibody to the membrane. Incubate at 4°C overnight on an orbital shaker.
- Recover the primary antibody (can be reused 3–4 times; store at −20°C with 0.02% NaN3 added to inhibit microbial growth).
- Wash the membrane with TTBS three times, 10 minutes per wash.
Secondary Antibody Incubation
- Dilute secondary antibody (goat anti-rabbit IgG-HRP) 1:1000 in TTBS.
- Add the diluted secondary antibody to the membrane. Incubate at 4°C for 2 hours (or room temperature for 1 hour), on an orbital shaker.
- Recover the secondary antibody (can be reused 2–3 times; store at −20°C). Do not add NaN3 to secondary antibody stock.
- Wash the membrane with TTBS three times, 10 minutes per wash.
ECL Detection and Imaging
- Prepare ECL reagent fresh immediately before use (protect from light): mix Solution A and Solution B in a 1:1 ratio (600 µl A + 600 µl B per membrane).
- Drain excess TTBS from the membrane. Evenly apply the ECL working reagent across the membrane surface. Allow to react for 1–2 minutes.
- Transfer the membrane to the chemiluminescence imaging system. Acquire images at multiple exposure times (e.g., 30 s, 1 min, 3 min) to ensure optimal signal without saturation.
- Save all images. Note the exposure time for each image.
NOTE: The expected molecular weights for anti-His signal are: ICCG-DoT — 39.9 kDa; TfCa-DoG — 64.79 kDa; ScafGVT — 58.96 kDa.
Summary: Protein Expression, Purification & Detection Pipeline
| Protocol | Purpose | Key Reagent / Method | Critical Parameter |
|---|---|---|---|
| 7. Protein Expression | Express His-tagged protein in E. coli | IPTG induction; strain-specific conditions | Temperature, IPTG conc., induction time (see Section 7.4) |
| 8. Cell Lysis / Sonication | Release soluble protein from cells | Lysis buffer + probe sonication | 3 × 30 s pulses; amplitude 37%; keep sample on ice |
| 9. Ni-NTA IMAC Purification | Isolate His-tagged protein from lysate | PureCube 100 INDIGO Ni-Agarose (Cube Biotech) | Stepwise imidazole wash; construct-specific concentrations (Section 9.4) |
| 10. SDS-PAGE | Assess protein size and purity | 10% Coomassie-stained PAGE gel | 35–45 µl per well; 100 V for ~2 hr in separating gel |
| 11. Western Blot | Confirm His-tag identity of target protein | Anti-His primary Ab (1:1000) + HRP secondary Ab | Overnight 4°C incubation with primary Ab; ECL detection |
Part 3: Enzyme Assay
Protocol 12: Qualitative PET Degrading Activity Screening — DMSO-Dissolved PET Agar Plate Assay
12.1 Purpose
The PET agar plate clearing assay provides a rapid, qualitative assessment of PET-degrading activity directly from bacterial cell fractions (pellet lysate, culture supernatant, and dialysed concentrated protein). PET dissolved in DMSO is incorporated into agar, forming a turbid plate. Enzymatic degradation of PET produces a visible clearing halo around the well, indicating hydrolytic activity. This assay was used to confirm that ICCG-DoT retains PETase activity after expression and purification, and to compare activity across different protein fractions.
12.2 Materials
Reagents
- Amorphous PET (APET) film or PET powder (for preparing PET-DMSO solution)
- DMSO (dimethyl sulfoxide; anhydrous)
- LB agar or Minimal Salt agar base
- Protein fractions to be tested: Pellet Lysate, Culture Supernatant, Empty Vector Control lysate, Dialysed Concentrated protein
- Sterile ddH2O or assay buffer (50 mM Tris-HCl pH 7.5)
Equipment
- Autoclave
- Sterile Petri dishes
- Cork borer or sterile 6–8 mm punch (for creating wells in the agar)
- Pipettes and sterile tips
- 37°C incubator
12.3 Preparation of PET-DMSO Agar Plates
- Dissolve amorphous PET in DMSO to prepare a concentrated PET-DMSO stock solution. The concentration should be sufficient to produce visible turbidity when incorporated into agar (typically 1–2% w/v PET in DMSO).
- Prepare LB agar or minimal salt agar base. Autoclave and allow to cool to approximately 50°C (just above the solidification point) before adding PET-DMSO solution.
- Add the PET-DMSO stock to the cooled agar at the appropriate volume to achieve the desired final PET concentration. Mix thoroughly but gently to avoid bubble formation.
- Pour the PET-containing agar immediately into sterile Petri dishes. The agar will appear turbid or milky due to the dispersed PET particles. Allow to solidify at room temperature.
- Once solidified, use a sterile cork borer (6–8 mm diameter) to punch evenly spaced wells in the agar. Divide the plate into quadrants, with one well per quadrant.
NOTE: Plates can be prepared in advance and stored at 4°C for up to one week. Pre-warm plates to 37°C for 30 minutes before use.
12.4 Assay Procedure
- Label each well according to the sample to be applied: Pellet Lysate (A), Culture Supernatant (B), Empty Vector Control (C), and Dialysed Concentrate (D).
- Load 100 µl of each protein fraction into the corresponding well. For the empty vector control, use lysate from E. coli transformed with pET28a(+) empty vector (no insert).
- Incubate the plates at 37°C for 48–96 hours. Check plates at 24-hour intervals for clearing halo formation.
- Photograph plates under standard white light illumination at each time point. Record the diameter of any clearing zones (mm) as a semi-quantitative measure of activity.
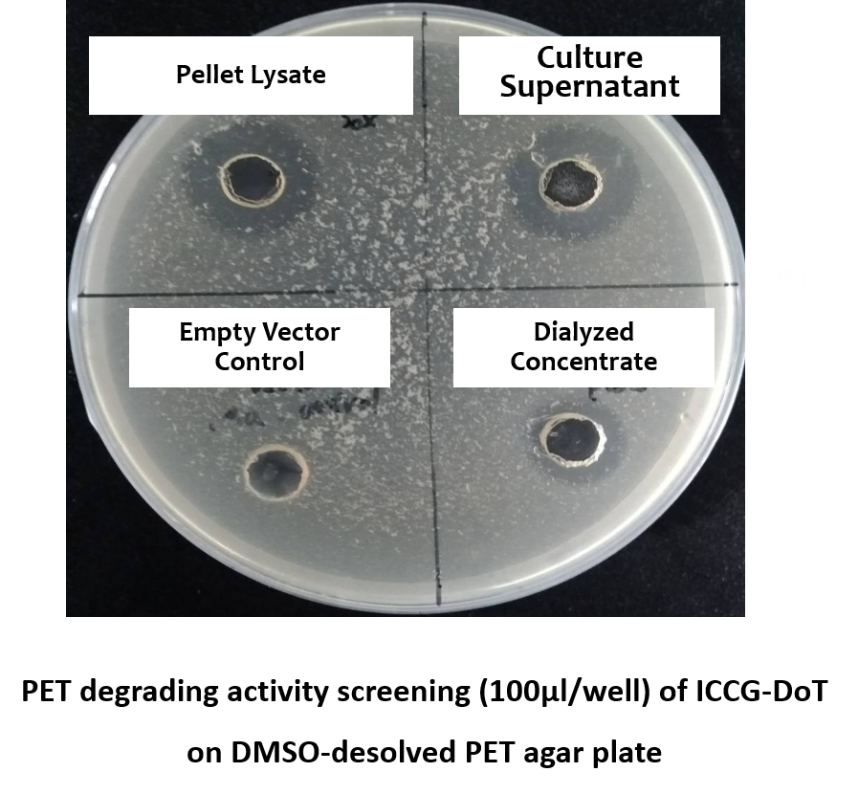
NOTE: In this project, ICCG-DoT activity was screened at 100 µl per well. Visible clearing halos were observed for the Dialysed Concentrate fraction, confirming PETase activity of the purified protein. No clearing was observed for the Empty Vector Control, as expected.
NOTE: The absence of clearing in the Pellet Lysate and Culture Supernatant fractions is consistent with the periplasmic/intracellular expression of ICCG-DoT directed by the pelB signal peptide, which targets secretion to the periplasm rather than the culture medium.
Protocol 13: HPLC Quantification of PET Hydrolysis Products
13.1 Purpose
High-performance liquid chromatography (HPLC) was used to quantitatively identify and measure the concentrations of PET hydrolysis products — specifically bis(2-hydroxyethyl) terephthalate (BHET), mono(2-hydroxyethyl) terephthalate (MHET), and terephthalic acid (TPA) — released from amorphous PET (APET) film by ICCG-DoT. HPLC provides chromatographic separation of these structurally related products, allowing simultaneous identification by retention time and quantification by peak area integration.
13.2 Reaction Setup for APET Film Degradation
The following conditions were used for the APET film degradation reaction prior to HPLC analysis:
| Parameter | Condition |
|---|---|
| Enzyme | ICCG-DoT (dialysed concentrate) |
| Enzyme concentration | 100 mU · mL−1 |
| Substrate | APET (amorphous PET) film |
| Reaction volume | 5 mL in reaction buffer |
| Reaction buffer | 50 mM Tris-HCl, pH 7.5 |
| Temperature | 37°C |
| Agitation | 230 rpm (orbital shaker) |
| Reaction duration | 96 hours |
| Sample dilution for HPLC | 2.5× dilution of reaction supernatant |
13.3 Sample Preparation for HPLC
- At the end of the reaction period (96 hours), remove the APET film from the reaction mixture. Centrifuge the reaction supernatant at 13,000 × g for 10 minutes to remove any PET film debris or precipitates.
- Collect the clarified supernatant. Dilute 2.5-fold with HPLC-grade water or mobile phase buffer (e.g., mix 400 µl supernatant + 600 µl buffer).
- Filter the diluted sample through a 0.22 µm syringe filter (PVDF or nylon membrane) directly into an HPLC vial. This removes particulates that could clog the HPLC column.
- Prepare standard solutions of BHET, MHET, and TPA at known concentrations in the mobile phase for construction of calibration curves. A minimum of 5 concentration points spanning the expected sample range should be prepared.
13.4 HPLC Instrument Parameters
| Parameter | Setting / Condition |
|---|---|
| Column type | Reversed-phase C18 column (e.g., 250 mm × 4.6 mm, 5 µm particle size) |
| Mobile phase A | 0.1% (v/v) phosphoric acid in HPLC-grade water |
| Mobile phase B | Acetonitrile (HPLC grade) |
| Gradient programme | 0–5 min: 5% B; 5–20 min: 5→50% B; 20–25 min: 50% B; 25–26 min: 50→5% B; 26–30 min: 5% B (re-equilibration) |
| Flow rate | 1.0 mL/min |
| Column temperature | 25–30°C |
| Detection wavelength | UV at 240 nm (for simultaneous detection of BHET, MHET, and TPA) |
| Injection volume | 10–20 µl |
| Run time | 30 minutes per sample |
NOTE: Expected retention times under these conditions: TPA elutes at approximately 11.2 minutes; MHET at approximately 12.0 minutes; BHET at approximately 12.4 minutes. Verify with authentic standards prior to sample analysis.
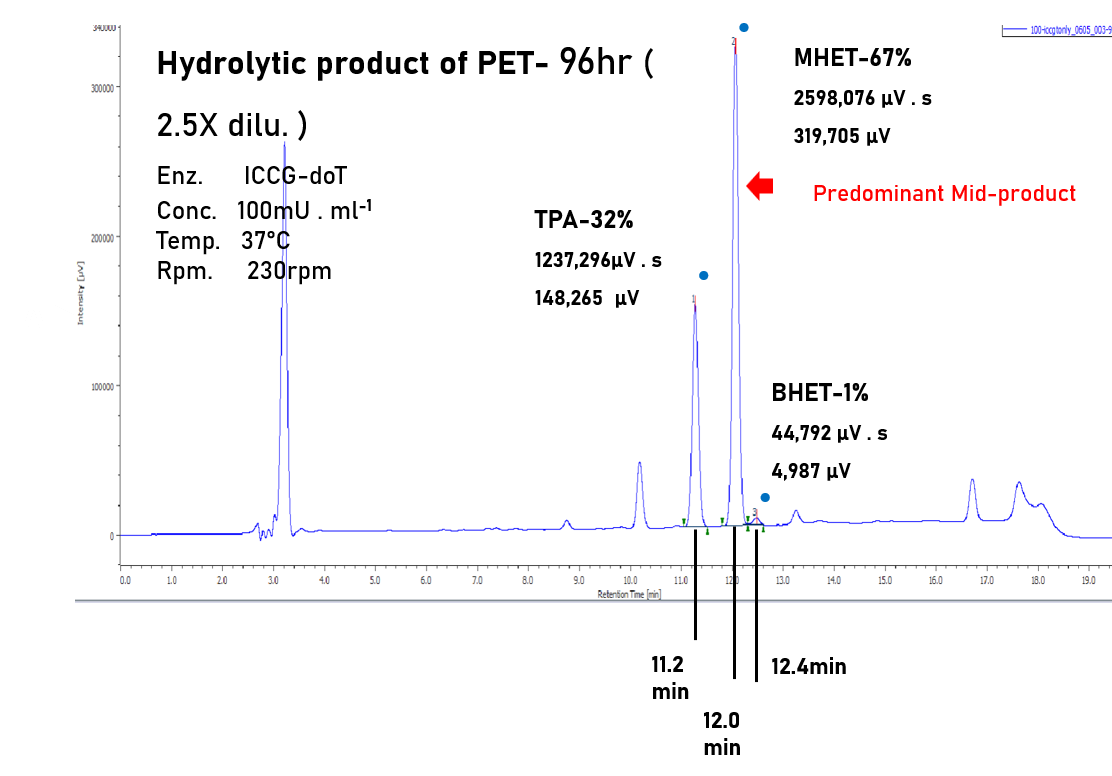
NOTE: MHET was the predominant product detected after 96 hours of ICCG-DoT activity on APET film (67% of total peak area), with TPA accounting for 32% and BHET for 1%, indicating that ICCG-DoT efficiently cleaves PET chains to release MHET as the primary intermediate product.
13.5 Data Analysis
- Identify each product peak by comparing the retention time with authentic standards of BHET, MHET, and TPA.
- Quantify each product using the peak area integration values. Calculate the concentration of each product from the calibration curve constructed from the standard solutions.
- Express results as the molar fraction (%) of each product relative to the total hydrolysis products detected, and as absolute concentration (µM) in the reaction supernatant (correcting for the 2.5× dilution factor).
- Record the following for each HPLC run: sample ID, injection volume, peak retention times, peak areas (µV·s), and peak heights (µV). These data constitute the primary HPLC dataset.
Protocol 14: Quantitative Specific Activity Assay — BHET Substrate Kinetics
14.1 Purpose
This protocol describes the quantitative enzyme activity assay used to measure and compare the specific activity (µM product released per µg enzyme per hour) of the recombinant constructs individually and in combination. Bis(2-hydroxyethyl) terephthalate (BHET) was used as a soluble, defined substrate that closely mimics the PET polymer chain structure, enabling precise kinetic measurements. This assay was used to: (i) compare ICCG-DoT vs. ICCG (without dockerin) activity toward BHET, MHET, and TPA over time; (ii) test the effect of ScafGVT scaffold on ICCG-DoT activity; and (iii) assess synergistic activity of ICCG-DoT plus TfCa-DoG in combined reactions.
14.2 Materials
Reagents
- BHET (bis(2-hydroxyethyl) terephthalate) substrate — 98 µM working concentration
- Purified ICCG-DoT protein (dialysed concentrate)
- Purified TfCa-DoG protein (dialysed concentrate; for combined assay)
- Purified ScafGVT scaffold protein (dialysed concentrate; for scaffold synergy assay)
- Reaction buffer: 50 mM Tris-HCl, pH 7.5
- Microcentrifuge tubes (1.5 mL)
- Orbital shaker capable of 230 rpm at controlled temperature
- HPLC instrument (see Protocol 13) for product quantification
14.3 Standard Reaction Conditions
| Parameter | Condition |
|---|---|
| Total reaction volume | 5 mL in reaction buffer (50 mM Tris-HCl, pH 7.5) |
| BHET substrate concentration | 98 µM |
| Enzyme concentration | 100 mU · mL−1 for each enzyme |
| ScafGVT scaffold (where applicable) | 1 µg · mL−1 |
| Reaction temperature | 37°C (for ICCG-DoT/TfCa-DoG combination assay); 50°C (for ICCG-DoT scaffold synergy assay) |
| pH | 7.5 |
| Agitation | 230 rpm (orbital shaker) |
| Sampling time points | 0, 1, 2, 3, 14, 19, 24 hr (combined assay); 24, 48, 72, 96 hr (scaffold synergy assay) |
14.4 Experimental Groups
Four experimental groups were included in each run to allow direct comparison:
| Group | Components | Purpose |
|---|---|---|
| ICCG-DoT alone (ICCG-T) | ICCG-DoT (100 mU · mL−1) | Baseline PETase activity with dockerin fusion |
| TfCa-DoG alone (TfCa-G) | TfCa-DoG (100 mU · mL−1) | Baseline MHETase activity alone |
| ICCG-DoT + TfCa-DoG (1:1) | ICCG-DoT (100 mU · mL−1) + TfCa-DoG (100 mU · mL−1) | Combined PETase + MHETase activity; synergy test |
| ICCG (no dockerin) + TfCa-DoG (ICCGT+TfCaG) | ICCG (100 mU · mL−1) + TfCa-DoG (100 mU · mL−1) | Positive control: unfused enzyme combination |
| ICCG-DoT + ScafGVT | ICCG-DoT (100 mU · mL−1) + ScafGVT (1 µg · mL−1) | Test effect of scaffold assembly on PETase activity |
| ICCG-DoT alone (no scaffold control) | ICCG-DoT (100 mU · mL−1) | Negative control for scaffold synergy test |
14.5 Step-by-Step Procedure
Reaction Setup
- Prepare all enzyme and substrate stock solutions on ice. Calculate volumes required for each reaction based on measured protein concentrations (from BCA assay, Protocol 9.6).
- In a 15 mL conical tube or suitable reaction vessel, add reaction buffer (50 mM Tris-HCl, pH 7.5) to approximately 80% of the final reaction volume (4 mL of 5 mL total).
- Add BHET substrate to a final concentration of 98 µM. Mix by gentle inversion.
- Add enzyme(s) at 100 mU · mL−1 final concentration (each). For the combined assay, add both enzymes simultaneously. For the scaffold assay, add ScafGVT at 1 µg · mL−1. Add buffer to bring the total volume to exactly 5 mL.
- Mix by gentle inversion. Transfer 100 µl immediately to a 1.5 mL tube on ice as the t = 0 sample (no reaction control).
Incubation and Sampling
- Place the reaction vessel in an orbital shaker at the specified temperature (37°C or 50°C depending on the assay; see Section 14.3) and 230 rpm. Start timing from this point.
- At each time point (1, 2, 3, 14, 19, and 24 hours for the combined assay; or 24, 48, 72, and 96 hours for the scaffold synergy assay), withdraw a 100 µl aliquot from the reaction.
- Immediately transfer the aliquot into a pre-labelled 1.5 mL tube and place on ice to stop the reaction. Centrifuge at 13,000 × g for 5 minutes at 4°C to pellet any insoluble material.
- Transfer the clarified supernatant to a new labelled tube. Store at −20°C until HPLC analysis.
HPLC Analysis of Reaction Aliquots
- Dilute each time-point aliquot as required (typically no dilution or 2–5× depending on substrate conversion) and filter through a 0.22 µm membrane directly into an HPLC vial.
- Inject each sample according to the HPLC method in Protocol 13, Section 13.4.
- Quantify BHET, MHET, and TPA concentrations at each time point from the calibration curve.
14.6 Calculation of Specific Activity
Specific activity is calculated as the amount of product released (in µM) per unit mass of enzyme (in µg) per unit time (per hour):
Specific Activity (µM · µg−1) = [Product] (µM) ÷ Enzyme amount (µg) ÷ Time (hr)
where [Product] is the measured concentration of BHET consumed or MHET/TPA produced in µM; enzyme amount is derived from the total enzyme mass added to the reaction (concentration in µg/mL × volume in mL); and time is the incubation duration in hours at each sampling point.
For the combined ICCG-DoT + TfCa-DoG assay, the mole fraction (χ) of each substrate/product is reported as a dimensionless ratio relative to the initial substrate concentration, as follows:
χ (BHET) = [BHET]t ÷ [BHET]0 χ (MHET) = [MHET]t ÷ [BHET]0 χ (TPA) = [TPA]t ÷ [BHET]0
Protocol 15: Scaffold Synergy Assay — ICCG-DoT with ScafGVT on APET Film
15.1 Purpose
This assay tests whether the trimeric cohesin scaffold protein (ScafGVT) has any positive or negative effect on the PET-degrading activity of dockerin-fused ICCG-DoT, when the two proteins are combined to allow cohesin-dockerin assembly in solution prior to adding the APET film substrate. The assay monitors the kinetics of BHET, MHET, and TPA production over 96 hours at 50°C.
15.2 Reaction Conditions
| Parameter | Condition |
|---|---|
| Enzyme | ICCG-DoT (dockerin-fused PETase) |
| Scaffold | ScafGVT (trimeric cohesin scaffold; Coh-G, Coh-V, Coh-T) |
| Enzyme concentration | 100 mU · mL−1 (ICCG-DoT) |
| Scaffold concentration | 1 µg · mL−1 (ScafGVT) |
| Substrate | APET film (amorphous PET) |
| Reaction buffer | 50 mM Tris-HCl, pH 7.5, 5 mL total volume |
| Temperature | 50°C |
| Agitation | 230 rpm |
| Time points | 24, 48, 72, 96 hours |
| Control | ICCG-DoT alone (no ScafGVT) at equivalent concentration |
15.3 Pre-Assembly of ScafGVT and ICCG-DoT
- Mix purified ScafGVT and ICCG-DoT at the specified concentrations in reaction buffer. Incubate on ice for 30 minutes prior to addition of the APET film substrate to allow cohesin-dockerin complex formation.
- Add the APET film to the pre-assembled enzyme-scaffold mixture to initiate the reaction. Transfer to the orbital shaker at 50°C, 230 rpm.
- Collect time-point aliquots (100 µl each) at 24, 48, 72, and 96 hours as described in Protocol 14, Section 14.5.
- Analyse aliquots by HPLC (Protocol 13) to quantify BHET, MHET, and TPA production at each time point.
- Calculate specific activity for each time point as described in Protocol 14, Section 14.6. Plot specific activity (µM · µg−1) against time (hours) separately for BHET consumption, MHET production, and TPA production.
Summary: Enzyme Activity Assay Pipeline
The table below summarises all four activity assays performed in this project, their purpose, key conditions, and the constructs evaluated.
| Protocol | Assay Type | Substrate | Key Conditions | Constructs Evaluated | Primary Output |
|---|---|---|---|---|---|
| 12. PET Agar Plate | Qualitative screening | DMSO-dissolved PET agar | 37°C; 48–96 hr; 100 µl/well | ICCG-DoT fractions vs. empty vector control | Clearing halo (yes/no); halo diameter |
| 13. HPLC Product ID | Product identification & quantification | APET film | 37°C; 230 rpm; 96 hr; 100 mU/mL ICCG-DoT; 2.5× dilution | ICCG-DoT | BHET/MHET/TPA % composition and concentration (µM) |
| 14. BHET Kinetic Assay | Quantitative specific activity | BHET (98 µM) | 37°C (combined) or 50°C (scaffold); pH 7.5; 230 rpm; 100 mU/mL | ICCG-DoT, TfCa-DoG, ICCG-DoT+TfCa-DoG, ICCG+TfCa-DoG | Specific activity (µM · µg−1) vs. time; χ BHET/MHET/TPA |
| 15. Scaffold Synergy Assay | Scaffold effect on PETase | APET film | 50°C; pH 7.5; 230 rpm; 100 mU/mL ICCG-DoT; 1 µg/mL ScafGVT | ICCG-DoT ± ScafGVT | Specific activity (µM · µg−1) vs. time (24–96 hr) |
Results
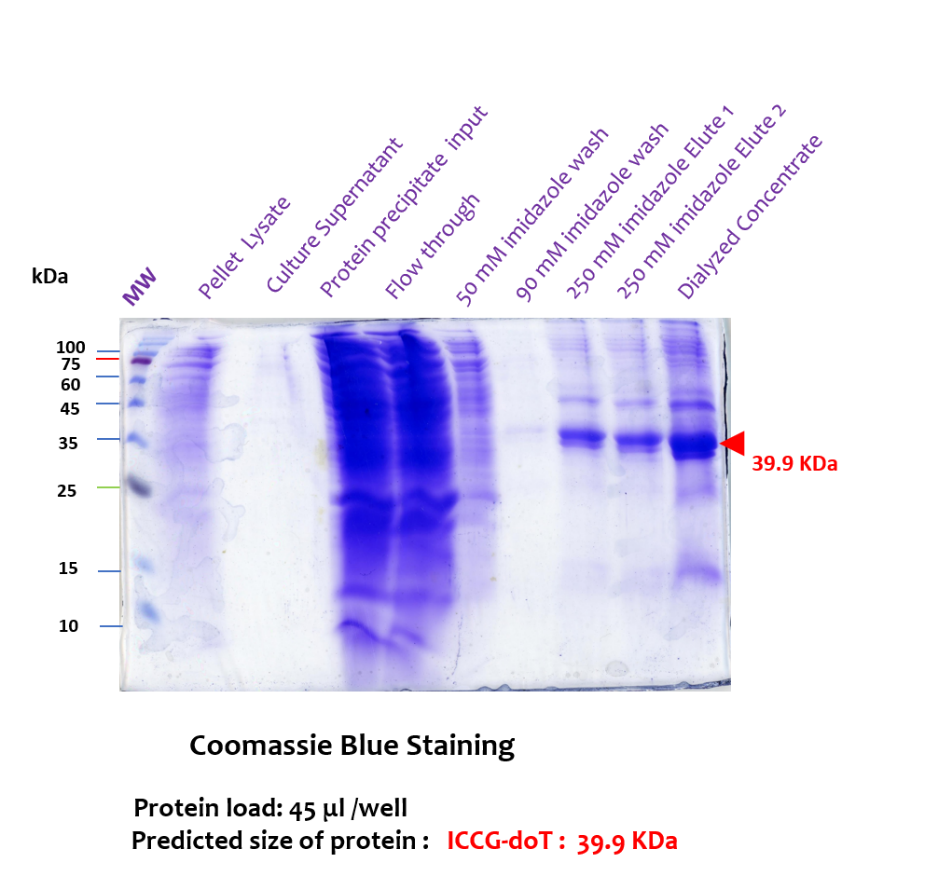
Result (SDS-PAGE): the Coomassie-stained gel shows total protein across sequential Ni-NTA IMAC purification fractions. A prominent band at approximately 39.9 kDa is visible in the 250mM imidazole elution fractions and the dialysed concentrate, consistent with ICCG-DoT's predicted molecular weight.
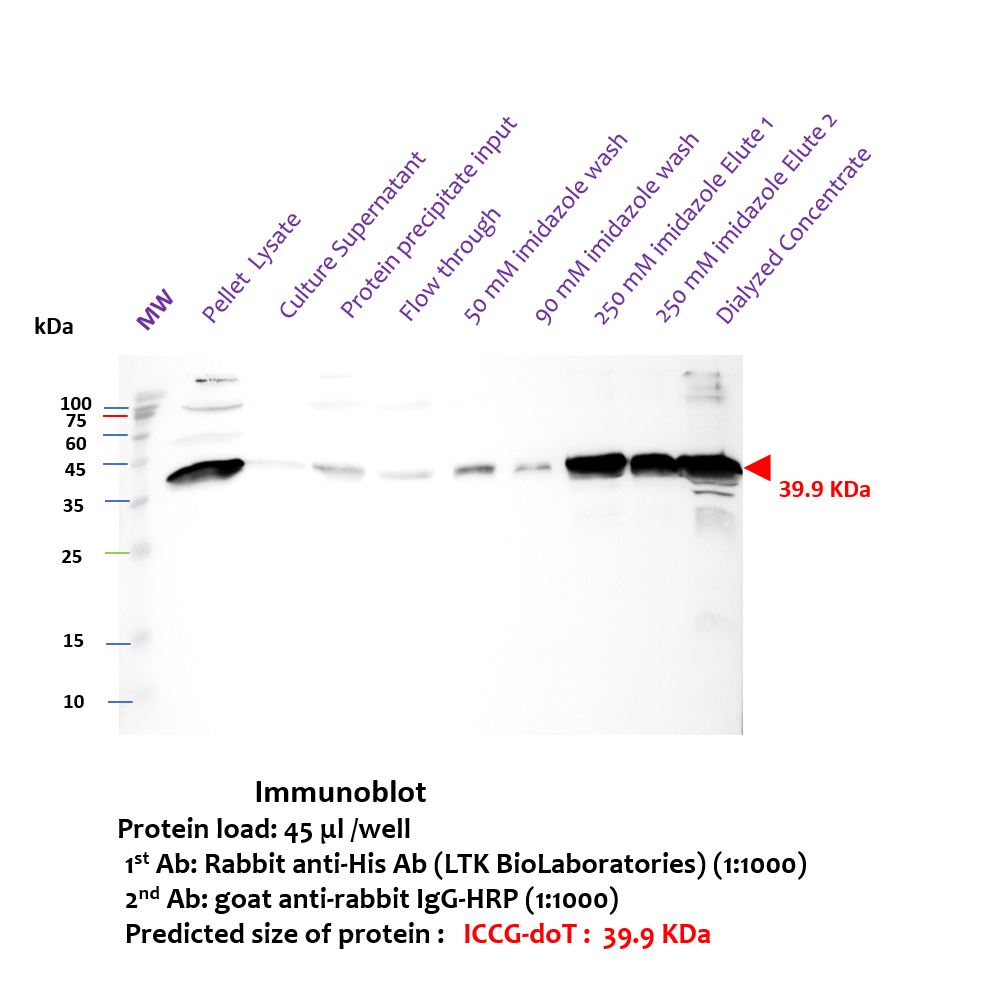
Result (Western Blot): anti-His antibody detection confirmed the identity of the ~39.9 kDa band observed in the SDS-PAGE as the His-tagged ICCG-DoT protein.
Result (Plate Assay): the plate assay confirmed that purified ICCG-DoT displayed PET-degrading activity, shown by a clearing halo in the dialysed-concentrate quadrant. The absence of a halo in the empty-vector control rules out non-specific background activity.
Result (HPLC): HPLC demonstrated that ICCG-DoT effectively depolymerises APET film after 96 hours, generating predominantly MHET (67%) with TPA (32%) and trace amounts of BHET (1%). The predominance of MHET over TPA indicates that ICCG-DoT is active primarily as a PETase, with comparatively little activity as an MHETase — the same bottleneck motivating the project's two-enzyme PETosome design.
Note: a standard curve for TPA quantification was still outstanding as of this write-up and is not yet included here.
External Relevant Depolymerization
This section reflects work performed by Qi Jia, an external advisor to the team, and is presented here as supplementary/comparative material rather than the team's own primary experimental work.
Materials and Reagents
Four recombinant constructs (ICCG-DoT, TfCa-DoG, ScafGVT, TfCaWA-DoG) were built in a pET28a(+) backbone under T7-promoter control, each carrying a C-terminal TEV-cleavage site and 8×His tag.
Cloning: Q5® High-Fidelity DNA Polymerase (NEB #M0491) for all insert amplification (25µl/50µl reaction scales, 0.5µM primers, 200µM dNTPs); NEB high-fidelity restriction enzymes for directional cloning; NEB Quick Ligation Kit (1:3 vector:insert, 5 min, 25°C); chemically competent E. coli DH5α for propagation (heat shock 42°C, 30s; 60 min recovery); Taq 2× Master Mix for colony PCR screening; Sanger sequencing for final verification.
Expression: conditions optimised per construct — ICCG-DoT in BL21 Rosetta(DE3), Terrific Broth, 0.5mM IPTG at OD₆₀₀ 0.6–0.8, 37°C, 24h; TfCa-DoG in BL21(DE3), LB + 2mM CaCl₂, 5mM IPTG, 18°C, 15h; ScafGVT in BL21(DE3), LB, 0.2mM IPTG, 16°C, 19h.
Purification: PureCube 100 INDIGO Ni-Agarose IMAC (10mM imidazole equilibration, 50/90mM washes, 250mM elution; TfCa-DoG received an additional 300–500mM elution step); dialysis into 50mM Tris pH 7.5, 150mM NaCl, 10% glycerol; Pierce BCA assay for quantification.
Activity assays: para-nitrophenyl butyrate (PNPB) esterase assay (250µM PNPB, 1× TBS + 10mM CaCl₂ + 10% DMSO, pH 7.5, 405nm); DMSO-dissolved APET agar plates (1–2% w/v PET); reversed-phase C18 HPLC (0.1% phosphoric acid/acetonitrile gradient, 1 mL/min, UV 240nm) for product quantification against TPA/MHET/BHET standards.
Protocols
Each construct followed the same general cloning pipeline: PCR amplification → restriction digestion of insert and vector → ligation → transformation → colony PCR screening → miniprep and sequencing. From there, three complementary activity-assay protocols were used: (1) a qualitative PET-agar plate-clearing assay for rapid screening of degrading activity directly from cell fractions; (2) HPLC-based quantification of hydrolytic products released from amorphous PET (APET) film; and (3) quantitative kinetic assays against defined substrates (BHET, MHET) to measure individual-enzyme performance and synergistic effects of the assembled PETosome. Full numbered, step-by-step versions of every protocol — including reagent lists, reaction tables, and troubleshooting notes — are maintained in the team's internal protocol documents.
Purpose and Relevance
Each experiment maps onto a specific question in the PETosome design. The plate-clearing assay and HPLC product profiling confirm that the purified PETase (ICCG-DoT) is correctly folded and active against real PET, and reveal where the reaction stalls (MHET accumulates, marking MHET→TPA as the rate-limiting step — the exact bottleneck the project's MHETase is designed to relieve). The BHET kinetic assay tests two design-critical questions directly: does dockerin fusion cost the PETase activity, and does docking onto the scaffold cost anything further? The five-group APET-film assay then places those same comparisons in the context of the real polymer substrate rather than an isolated defined substrate, and adds a scaffold-dose condition and a no-enzyme control to rule out non-enzymatic degradation. Together, these experiments build the case for the PETosome incrementally: enzyme works → bottleneck identified → fusion cost measured → scaffold shown compatible → two-enzyme synergy demonstrated on both a defined substrate and real PET film.
Experimental Design: Controls and Replicates
The five-group APET-film assay illustrates the design pattern used throughout: Group 1 (ICCG-DoT alone, 100 mU) as the baseline; Group 2 (ICCG-DoT + TfCa-DoG, 100/100 mU) as the core synergy test; Group 3 (100/300 mU) to test whether raising the MHETase dose helps or hurts; Group 4 (Group 2 + 1µg/mL ScafGVT) to test scaffold compatibility; and Group 5 (PET substrate, no enzyme) as the negative control ruling out non-enzymatic hydrolysis. Reaction composition was specified down to the microlitre (e.g. Group 2: 6.24µl ICCG-DoT + 2.05µl TfCa-DoG topped to 5 mL with 2nd-generation reaction buffer), with all five groups run in parallel at matched temperature (50°C) and agitation (230 rpm).
Each group was run with 3 repeats, sampled daily (5 groups × 3 repeats = 15 samples per timepoint). The replicate count was a deliberate resource trade-off rather than a statistically-derived target: every additional repeat consumes lab time and reagents (purified enzyme stock, HPLC run time, consumables), and with a fixed two-week experimental window and limited reagent supply, 3 repeats per condition was judged the largest number the team could sustain across all conditions and timepoints without compromising the breadth of the DBTL cycle (multiple constructs, multiple assay types, two full time-course experiments). This is a real constraint of a first-cycle, resource-limited student project, and is treated as such rather than presented as a statistically optimised sample size.
Statistical Analysis: Does the Scaffold Change PET-Degradation Kinetics?
This section analyses the depolymerisation activity data from the PETosome constructs (ICCG-DoT, TfCa-DoG, ScafGVT), comparing dockerin-fused and scaffold-docked enzyme conditions against free-enzyme controls, and testing the project's core two-enzyme synergy claim.
Raw Data
Mean ± SD (n=2 or 3 replicates) product concentration for each PETosome condition and timepoint, TPA/MHET/BHET in µM:
| Condition | Time (h) | TPA (µM) | MHET (µM) | BHET (µM) | n |
|---|---|---|---|---|---|
| Va — ICCGt + GVT scaffold | 24 | 1.37 ± 0.26 | 5.19 ± 0.89 | 0.28 ± 0.05 | 2 |
| 48 | 70.01 ± 1.48 | 233.51 ± 4.48 | 12.72 ± 1.57 | 2 | |
| 72 | 401.57 ± 87.27 | 1093.69 ± 270.03 | 62.67 ± 21.60 | 2 | |
| 96 | 1052.61 ± 63.39 | 2609.80 ± 150.71 | 117.19 ± 12.28 | 2 | |
| Vac — ICCG only (free enzyme) | 24 | 19.89 ± 9.95 | 79.38 ± 34.45 | 5.69 ± 1.83 | 3 |
| 48 | 174.92 ± 35.77 | 479.11 ± 92.08 | 18.18 ± 3.30 | 3 | |
| 72 | 574.71 ± 110.43 | 1450.64 ± 311.37 | 57.51 ± 15.93 | 3 | |
| 96 | 1195.90 ± 88.51 | 2710.69 ± 166.97 | 115.24 ± 12.28 | 3 | |
| Vb — ICCG(noT) + GVT scaffold | 24 | 89.03 ± 14.33 | 301.15 ± 44.01 | 15.69 ± 4.60 | 3 |
| 48 | 402.69 ± 73.56 | 1289.08 ± 297.21 | 42.14 ± 11.72 | 3 | |
| 72 | 878.57 ± 84.83 | 2725.47 ± 315.53 | 83.46 ± 13.93 | 3 | |
| 96 | 1322.48 ± 81.32 | 2596.61 ± 64.00 | 63.54 ± 5.61 | 3 | |
| Vbc — ICCG(noT) only (free enzyme, no dockerin) | 24 | 93.30 ± 19.45 | 315.04 ± 44.88 | 17.03 ± 3.85 | 3 |
| 48 | 452.75 ± 26.75 | 1481.48 ± 261.33 | 52.23 ± 13.97 | 3 | |
| 72 | 973.19 ± 78.78 | 2267.99 ± 287.44 | 70.94 ± 12.31 | 3 | |
| 96 | 1362.90 ± 68.04 | 2675.22 ± 121.83 | 80.96 ± 9.77 | 3 |
Full individual-replicate data for the two-enzyme synergy assay (BHET substrate, product distribution in %), recovered from the original lab data rather than reported summary statistics:
| Condition | Time (h) | Replicate | TPA (%) | MHET (%) | BHET (%) |
|---|---|---|---|---|---|
| ICCG-T alone | 1 | Repeat 1 | 0.000 | 21.274 | 78.726 |
| Repeat 2 | 0.000 | 20.152 | 79.848 | ||
| Repeat 3 | 0.000 | 20.629 | 79.371 | ||
| 2 | Repeat 1 | 0.000 | 33.701 | 66.299 | |
| Repeat 2 | — | — | — | ||
| Repeat 3 | 0.000 | 34.355 | 65.645 | ||
| 3 | Repeat 1 | 0.000 | 45.469 | 54.531 | |
| Repeat 2 | 0.000 | 44.298 | 55.702 | ||
| Repeat 3 | 0.401 | 44.921 | 54.678 | ||
| 14 | Repeat 1 | 3.675 | 88.010 | 8.315 | |
| Repeat 2 | 3.445 | 88.980 | 7.575 | ||
| Repeat 3 | 3.681 | 89.401 | 6.919 | ||
| 19 | Repeat 1 | 5.306 | 90.101 | 4.593 | |
| Repeat 2 | 5.066 | 91.470 | 3.464 | ||
| Repeat 3 | 5.226 | 91.436 | 3.338 | ||
| 24 | Repeat 1 | 6.988 | 88.368 | 4.643 | |
| Repeat 2 | 6.751 | 90.130 | 3.119 | ||
| Repeat 3 | 6.913 | 90.328 | 2.759 | ||
| ICCG-T + TfCa-G | 1 | Repeat 1 | 0.000 | 70.715 | 29.285 |
| Repeat 2 | 0.308 | 74.833 | 24.859 | ||
| Repeat 3 | 0.309 | 73.323 | 26.368 | ||
| 2 | Repeat 1 | 0.673 | 84.817 | 14.511 | |
| Repeat 2 | 0.752 | 89.872 | 9.376 | ||
| Repeat 3 | 0.800 | 89.250 | 9.950 | ||
| 3 | Repeat 1 | 1.029 | 92.441 | 6.530 | |
| Repeat 2 | 1.050 | 94.791 | 4.159 | ||
| Repeat 3 | 1.079 | 94.880 | 4.042 | ||
| 14 | Repeat 1 | 5.425 | 93.676 | 0.899 | |
| Repeat 2 | 5.693 | 93.653 | 0.654 | ||
| Repeat 3 | 5.794 | 93.575 | 0.631 | ||
| 19 | Repeat 1 | 7.242 | 92.008 | 0.750 | |
| Repeat 2 | 7.575 | 91.759 | 0.666 | ||
| Repeat 3 | 7.706 | 91.505 | 0.789 | ||
| 24 | Repeat 1 | 9.078 | 89.057 | 1.215 | |
| Repeat 2 | 9.498 | 88.854 | 1.052 | ||
| Repeat 3 | 9.564 | 88.740 | 1.084 |
Note: ICCG-T alone, 2h, Repeat 2 was missing from the original lab data (recorded as blank) and is shown as —; it was excluded from the statistical tests below.
Statistical Tests
Two methods were used, chosen for the shape of each dataset rather than a default choice. Nonlinear regression + extra sum-of-squares F-test (fit a model curve to each condition, then test whether allowing two separate curves fits significantly better than forcing both conditions onto one shared curve) was used throughout, since product accumulation is a continuous kinetic process, not an arbitrary categorical grouping. The specific model differs by dataset: a power-law growth curve (y = a·tb) for concentrations still rising with no clear plateau (the PETosome µM data, and TPA% in the synergy assay), and a saturating exponential curve (y = A·(1−e−kt)) for MHET%, which visibly approaches a plateau within the observed time course.
BHET% was not separately tested: it is the compositional complement of TPA%+MHET% (BHET% ≈ 100 − TPA% − MHET%), so it carries no independent information, and its declining shape doesn't match either growth model used elsewhere — fitting a growth-shaped curve to a declining series would have been a modelling error, not a real result.
| Comparison | Product | Model | Statistic | p-value | Result |
|---|---|---|---|---|---|
| Va vs Vac (dockerin-fused PETase + scaffold vs. free untagged enzyme) | TPA | Power-law | F(2,16) = 10.13 | 0.0014 | Curves differ significantly |
| MHET | Power-law | F(2,16) = 4.73 | 0.024 | Curves differ significantly | |
| BHET | Power-law | F(2,16) = 0.08 | 0.93 | No significant difference | |
| Vb vs Vbc (scaffold present vs. absent, on an enzyme lacking the dockerin tag — a specificity control) | TPA | Power-law | F(2,20) = 1.44 | 0.26 | No significant difference |
| MHET | Power-law | F(2,20) = 0.07 | 0.93 | No significant difference | |
| BHET | Power-law | F(2,20) = 0.35 | 0.71 | No significant difference | |
| ICCG-T alone vs combined pair (the project's core two-enzyme synergy claim; full raw-replicate time course, 1–24h) | TPA% | Power-law | F(2,31) = 275.7 | <0.000001 | Significantly higher with both enzymes |
| MHET% | Saturating exponential | F(2,31) = 1537.8 | <0.000001 | Significantly higher with both enzymes |
Analysis
Three findings hold up under direct statistical testing, not just visual comparison of the numbers.
The two-enzyme synergy claim is now the strongest result in the entire dataset. Earlier testing of this claim relied on reported summary statistics (mean ± SD) at a single 24h endpoint. Recovering the original individual-replicate data across the full 1–24h time course allowed a proper curve-based test instead, and the result is decisive: both TPA yield (F(2,31) = 275.7) and MHET accumulation (F(2,31) = 1537.8) differ overwhelmingly between the PETase-alone and combined-pair conditions (p < 0.000001 for both). This is a substantially stronger evidentiary basis than the original endpoint-only comparison, not merely a re-confirmation of it.
The scaffold shows no detectable nonspecific effect on an enzyme that cannot dock onto it (Vb vs Vbc, p > 0.25 throughout) — a useful specificity control, since it means any effect attributed to the scaffold requires actual cohesin–dockerin binding, not just its presence in solution.
The Va vs Vac comparison shows real kinetic differences in TPA and MHET (but not BHET), consistent with the combined dockerin-fusion-plus-scaffold condition following a different, initially slower but ultimately convergent, accumulation curve relative to the free untagged enzyme — matching the qualitative "converges by 96h" description in the underlying report.
Caveat: the PETosome (Va/Vac/Vb/Vbc) comparisons still rely on small sample sizes (n=2–3 per condition) and summary-level data, so those three results should be read as supporting evidence rather than definitive proof. The synergy claim is on firmer ground, since it now rests on complete individual-replicate data across six timepoints rather than a single reported endpoint.
External Relevant Repolymerization
This section reflects work performed by Maroof, an external advisor to the team, and is presented here as supplementary/comparative material rather than the team's own primary experimental work.
Materials and Protocols
The goal of this component was to re-esterify recovered TPA and EG monomers into PET oligomers under mild conditions, rather than the 250–290°C, antimony-catalysed polycondensation used industrially. Two strategies were explored across two DBTL rounds.
Enzymatic route (deep eutectic solvent, DES): a choline-chloride/ethylene-glycol DES (7.0g ChCl + 5.6mL EG, 1:2 mol) formed at 80°C, with TPA (8.3g) and lipase catalyst added. Round 1 used Candida rugosa (CRB) lipase (10 wt% TPA, 24h). Round 2a switched to Novozyme 435 (immobilised Candida antarctica lipase B, 1.45g, 10wt%) plus 4Å molecular sieves (2.5g) to absorb the water of esterification, extended to 48h. Products were isolated by vacuum filtration, warm-water washing (3×), DCM extraction, and rotary evaporation; BHET was recovered separately from the DES filtrate by cold-water precipitation.
Chemical route (CDI activation): TPA was activated with carbonyldiimidazole (CDI) to a reactive terephthaloyl bis(imidazolide) intermediate, which EG then attacks to form the ester — without a metal catalyst or high temperature. Two solvents were compared: anhydrous DMAc (24h and 48h) and anhydrous THF (12h and 30h). Products were characterised by FTIR (ATR mode, 4000–500cm⁻¹), with ester formation diagnosed by the carbonyl C=O stretch shifting from 1673cm⁻¹ (carboxylic acid) to ~1720cm⁻¹ (ester).
Purpose and Relevance
Depolymerisation recovers TPA and EG monomers, but a genuinely closed material loop requires demonstrating that those monomers can be rebuilt into PET-like material. This component tests that second half directly, comparing a green enzymatic route against a chemical benchmark, so the team can report not just "PET broken down" but "PET broken down and rebuilt."
Results and Analysis
DES + CRB lipase (Round 1, 24h): FTIR retained the strong TPA carboxylic-acid C=O stretch at 1673cm⁻¹ with no clear ester C=O band near 1720cm⁻¹ — esterification was incomplete. Likely causes: lower CRB activity toward TPA than Novozyme 435, insufficient time, and water accumulation shifting the equilibrium back toward acid.
DES + Novozyme 435 + molecular sieves (Round 2a, 48h): the reaction separated into four phases (DES liquid, white semi-crystalline PET-oligomer solid, recyclable Novozyme beads, spent molecular sieves). A white semi-crystalline solid was isolated; full FTIR/NMR/GPC characterisation of this product was still pending as of this write-up.
CDI in DMAc (Round 2b): both 24h and 48h reactions confirmed ester formation, with comparable intensity — C=O at 1718.87cm⁻¹ (24h, +45.82cm⁻¹ vs TPA) and 1721.51cm⁻¹ (48h, +48.46cm⁻¹).
CDI in THF (Round 2c): gave the strongest ester signal of any condition tested — C=O at 1726.10cm⁻¹ (+53.05cm⁻¹) at 30h, versus 1717.30cm⁻¹ (+44.25cm⁻¹) at 12h. All three diagnostic PET FTIR peaks (aromatic ester C=O ~1721cm⁻¹, C–C–O ~1245cm⁻¹, O–C–C ~1100cm⁻¹) were reproduced in the CDI products, giving strong spectroscopic evidence that the synthesised material contains the PET ester repeat unit.
Caveat: the DES-enzymatic product (Round 2a) is visually consistent with PET oligomers but was not yet confirmed by FTIR/NMR/GPC at the time of this write-up, so it should be read as promising rather than confirmed. The CDI route's ester formation, by contrast, is directly confirmed by spectroscopic evidence across all three diagnostic peaks.